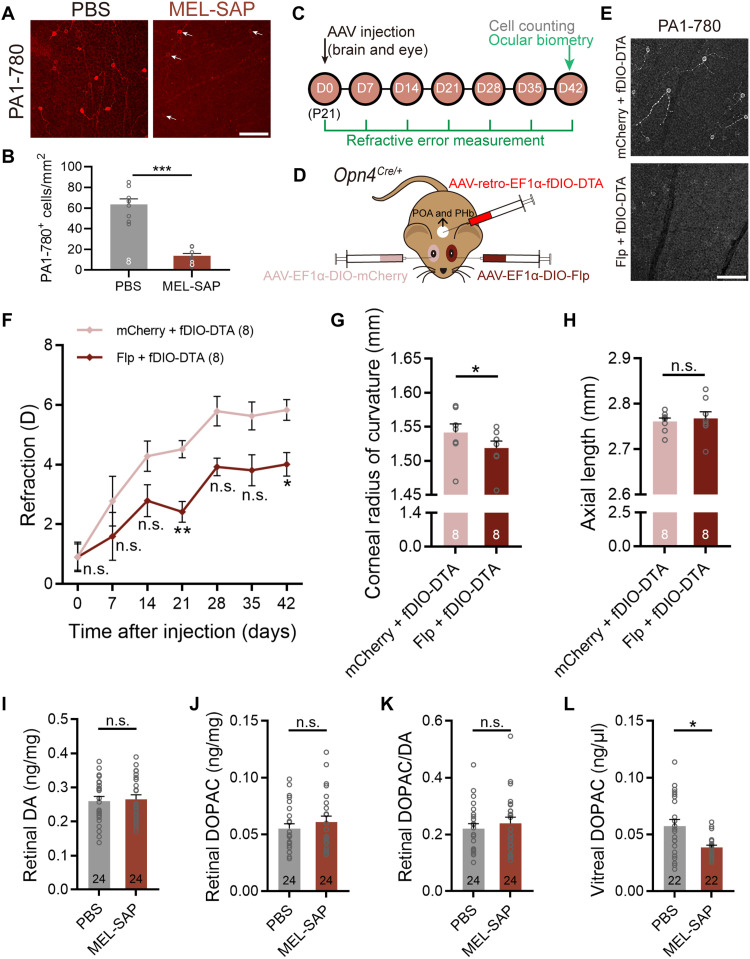
Fig. 8. IpRGC contribution to ocular development is accounted for by M1 cells and associated with reduced DA release.
(A and B) Representative microscopic images and pooled data showing a significant (~70%) reduction in the density of somata positive to the PA1-780 melanopsin antibody, which preferentially labels M1-type ipRGCs, in 400-ng MEL-SAP–treated C57BL/6 retinas. Arrows point to a few residual PA1-780–labeled cells. Scale bar, 100 μm. (C) Timeline of the procedure and data collection of the dual virus injection experiment. (D) Schematic illustration of selective M1 cell ablation in Opn4Cre/+ mice by intravitreal injection of AAV-EF1α-DIO-Flp and stereotaxic injection of an Flp-dependent DTA-coding retrograde virus (AAV-retro-EF1α-fDIO-DTA) to the POA and PHb, two nuclei to which ipRGC projections are predominantly from M1 cells. Fellow eyes were injected with AAV-EF1α-DIO-mCherry (control virus) for comparison. (E) Confocal micrographs showing that fDIO-DTA/DIO-Flp treatment significantly reduced PA1-780–positive signals in the Opn4Cre/+ retina, confirming the severe ablation of M1 cells. Scale bar, 100 μm. (F) The growth curve of refraction of M1 cell–ablated eyes showed a significant myopic shift as compared to that of control virus–injected fellow eyes. (G and H) Bar charts summarizing the results of ocular biometric measurements conducted at D42. M1 cell ablation significantly reduced the CRC (G) but did not change the AL (H). (I to L) Bar charts summarizing the results of HPLC analysis on samples harvested at D42. IpRGC ablation did not show appreciable effects on retinal DA (I) or DOPAC levels (J), nor did it alter the retinal DOPAC/DA ratio (K); however, it reduced vitreal DOPAC levels, an indicator of retinal DA release, significantly (L). Error bars represent SEM. *P < 0.05, **P < 0.01, ***P < 0.001.

