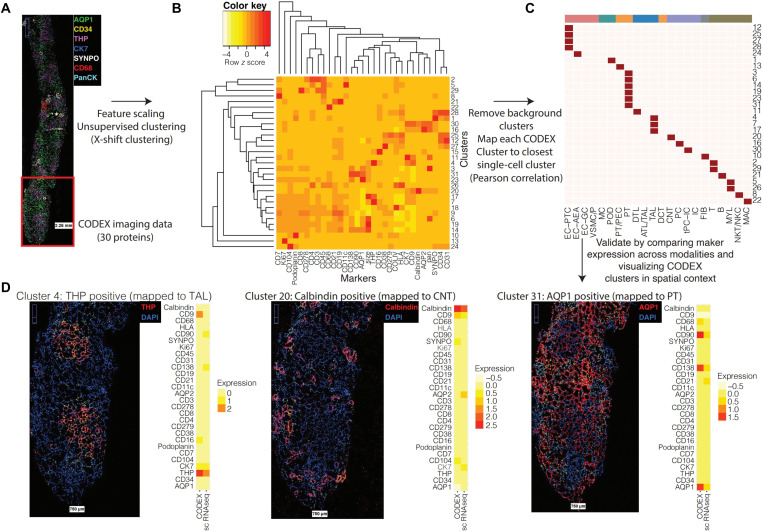
Fig. 3. Integration of single-cell and nucleus transcriptomic data with CODEX imaging data.
(A) CODEX imaging provides spatial localization for 30 proteins across 27,236 cells (spatial distribution of selected proteins visualized). (B) CODEX data were clustered using X-shift clustering to identify groups of cells expressing common subsets of protein markers. (C) Each CODEX cluster was mapped to the most similar transcriptomic cluster based on the Pearson correlation between the average scaled expression profiles. (D) Visualization of CODEX clusters in spatial context. Yellow dots indicate cells mapped to each cluster, and the side-by-side average expression profiles of the CODEX cluster and corresponding mapped transcriptomic cluster are shown.

