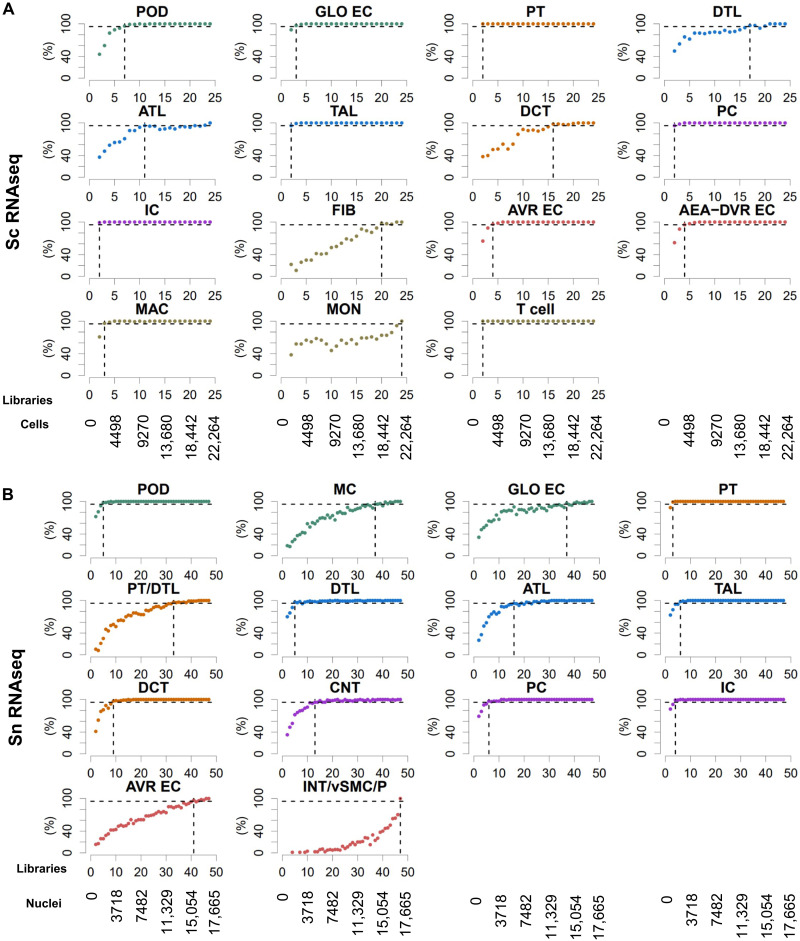
Fig. 4. Single-cell/nucleus transcriptomic post hoc power analyses show that nine libraries are sufficient to identify most major kidney cell types.
Subject libraries (or samples) were randomly and progressively removed from (A) the sc (24 libraries) and (B) sn (47 libraries) RNAseq to generate at maximum 100 non-overlapping random groups for the remaining samples. Sc and sn datasets were subjected to an automated data analysis pipeline (fig. S5A). To assign cell types to the identified clusters, we compared cluster-specific markers of each analysis with literature curated cell type–specific genes (fig. S5B). We counted how many analyses based on the same number of remaining libraries that have identified a particular cell type. Horizontal dashed lines mark the 95% plateau; vertical dashed lines indicate the lowest library quantity that allowed identification of a given cell type with a probability of 95%. See fig. S5 for complete post hoc power analysis results. See Fig. 2A for cell type abbreviations.

