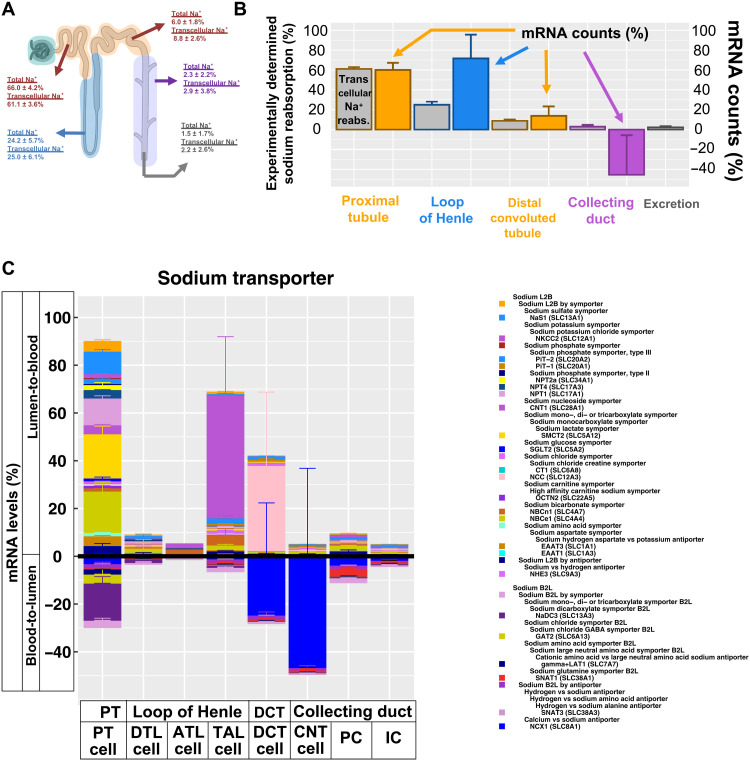
Fig. 7. Predicted sodium transport capacities match with experimentally determined reabsorption profiles.
(A) Estimated transcellular sodium reabsorption before and after removal of estimated paracellular sodium reabsorption from experimentally determined total sodium reabsorption profiles. (B) Using our and two other sn RNAseq datasets, we calculated the sum of all mRNA counts that mapped to genes involved in sodium lumen-to-blood (L2B) and blood-to-lumen (B2L) transport for each segment of the renal tubule. Net reabsorption capacities for sodium (colored bars) were determined by subtracting both sums and compared to experimentally determined transcellular sodium reabsorption (gray bars). (C) L2B and B2L cell type–specific transport mechanisms for sodium are visualized above and below the abscissa, respectively. Error bars document SEs. Parent-child relationships are documented in the legend, where children SCPs are written below their parent SCPs and shifted to the right. To prevent double counting, we removed any mRNA levels from each parent SCP that are already visualized as part of its child SCPs. Parent SCPs missing in the diagram were added to the legend next to an uncolored box for a proper documentation of the SCP hierarchy. In case of multiple parent SCPs, we only show one parent. Stacked bar diagram colors are in the same or reverse order as in the legend for L2B and B2L, respectively.

