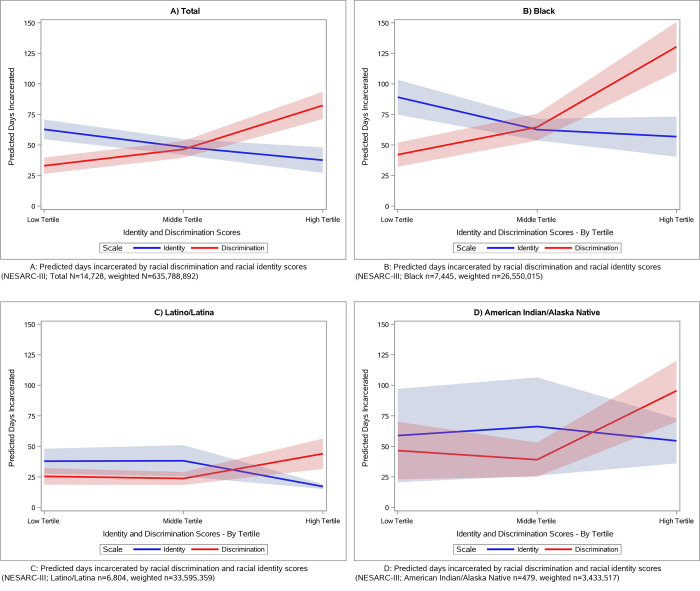
Fig 1. Predicted days incarcerated by racial discrimination and racial identity scores for the total sample and for Black, Latino/Latina, and American Indian/Alaska Native subgroups.
A: Predicted days incarcerated by racial discrimination and racial identity scores (NESARC-III; Total N = 14,728, weighted N = 635,788,892). B: Predicted days incarcerated by racial discrimination and racial identity scores (NESARC-III; Black n = 7,445, weighted n = 26,550,015). C: Predicted days incarcerated by racial discrimination and racial identity scores (NESARC-III; Latino/Latina n = 6,804, weighted n = 33,595,359). D: Predicted days incarcerated by racial discrimination and racial identity scores (NESARC-III; American Indian/Alaska Native n = 479, weighted n = 3,433,517).

