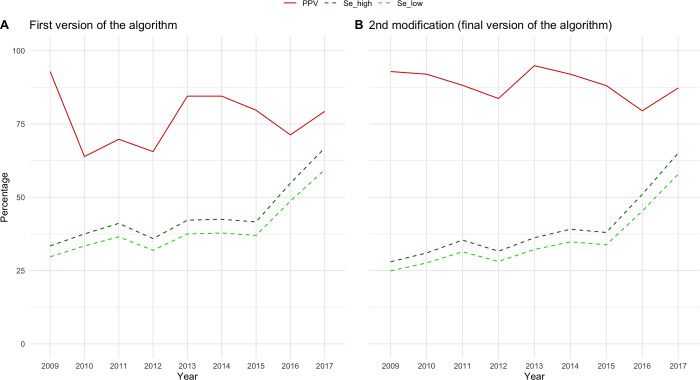
Fig 1. Positive predictive value (PPV) and sensitivity (SE) of first version and final version of the algorithm.
The figure shows the validity measures of the first and the final version of the algorithm. PPV was represented in red and SE in green (dark green–higher value of SE; light green–lower value of SE).

