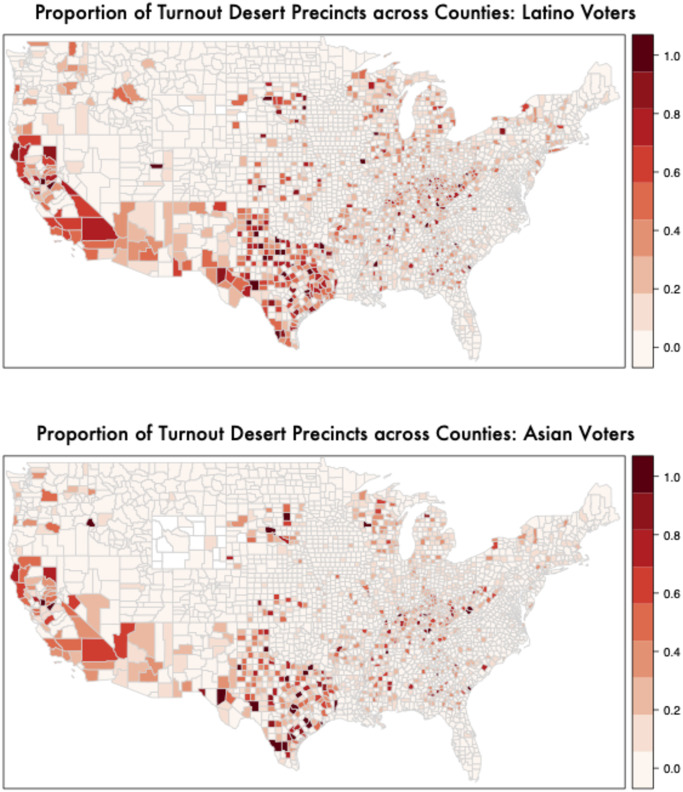
Fig 4. Mapping turnout deserts by racial groups (2) proportion of turnout desert precincts in a county by race (i.e. 1 standard deviation below the national average in voter turnout in 2016).
The top panel shows among precincts where Hispanic voters live and the bottom panel shows precincts where Asian voters live. Hispanic (36.2%) individuals are more than 3 times more likely to live in a turnout desert precinct than white voters (8.3%). Asian citizens are 2.6 times more likely to live in a turnout desert precinct than white voters. Minorities’ turnout deserts are spread across large/urban and small/rural locations. S13-S20 Figs in S1 File show similar maps for all groups in 2014 in addition to different definitions of turnout deserts.

