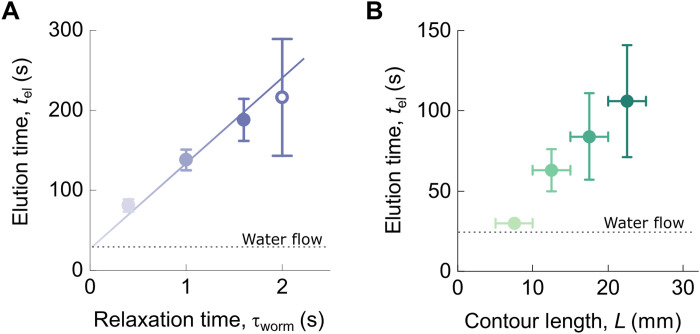
Fig. 3. Activity and contour-length dependence of the elution time of the active worms.
(A) Elution time of the active worms plotted against the relaxation time τworm of a single worm at four levels of activity. The colored line indicates a linear relationship. The elution time tel was measured for four different levels of activity (T = 5°, 10°, 25°C and in the presence of alcohol, open symbol). For all the temperatures, the contour length of the worms was kept constant (L = 15 ± 5 mm), and the elution time was averaged on six trajectories. (B) The elution time was measured on 13 worms from the same batch, varying in their contour length, and each worm averaged over six passages in the channel for T = 20°C. The contour lengths are binned on the x axis. Horizontal dashed lines represent the imposed flow rate in the channel. Error bars represent 1σ.

