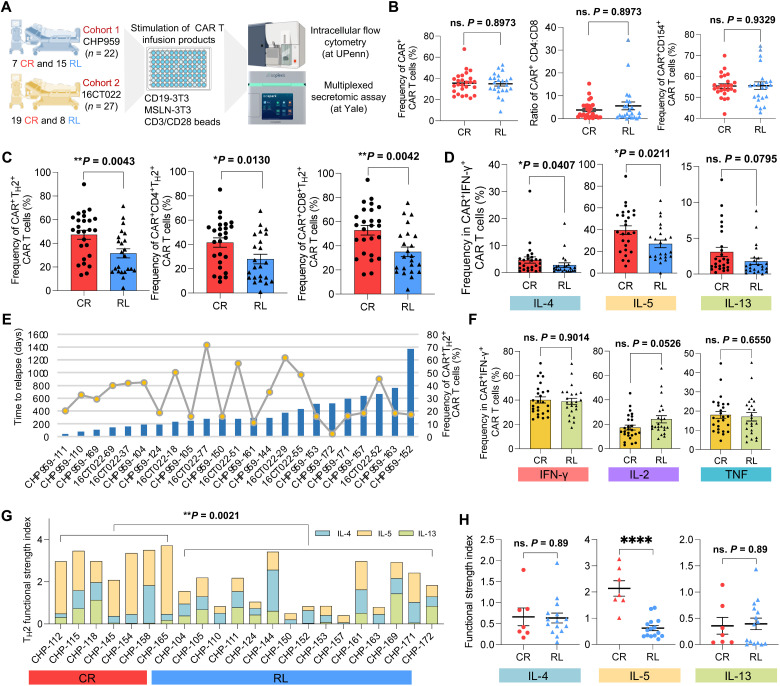
Fig. 5. Independent functional evaluation in expanded cohorts validates the deficiency of TH2 function in RL patients.
(A) Schematic of validation experimental design. (B) Comparison of CAR+ CAR T cell frequency, CD4:CD8 ratio, and CD154+ CAR T cell frequency between CR and RL patients. (C) Comparison of CAR+TH2+ CAR T cell frequency between CR and RL patients. Left, combined CD4+ and CD8+; middle, CD4+; right, CD8+. TH2 measures the combined frequency of IL-4+, IL-5+, and IL-13+ cells. (D) Frequency comparison of each TH2-related cytokine+ CAR T cells between CR and RL patients. (E) Correlation between TH2+ CAR T cell frequency and the relapse-free duration to the therapy. Bar plots show the days to relapse of each RL patient. Line and dot plots show the frequency of CAR+TH2+ cell of each RL patient. (F) Frequency comparison of major TH1-related cytokine+ CAR T cells between CR and RL patients. (G) Comparison of the TH2 functional strength index (FSI) between CR and RL groups, which was measured by multiplexed secretomic assay using Isoplexis devices. FSI denotes to the frequency of cells secreting specific cytokine multiplied by the average signal intensity of this cytokine. (H) PSI comparison of IL-4, IL-5, and IL-13 between CR and RL groups. All the P values were calculated with Mann-Whitney test. Scatter plots show means ± SEM. ****P < 0.0001.

