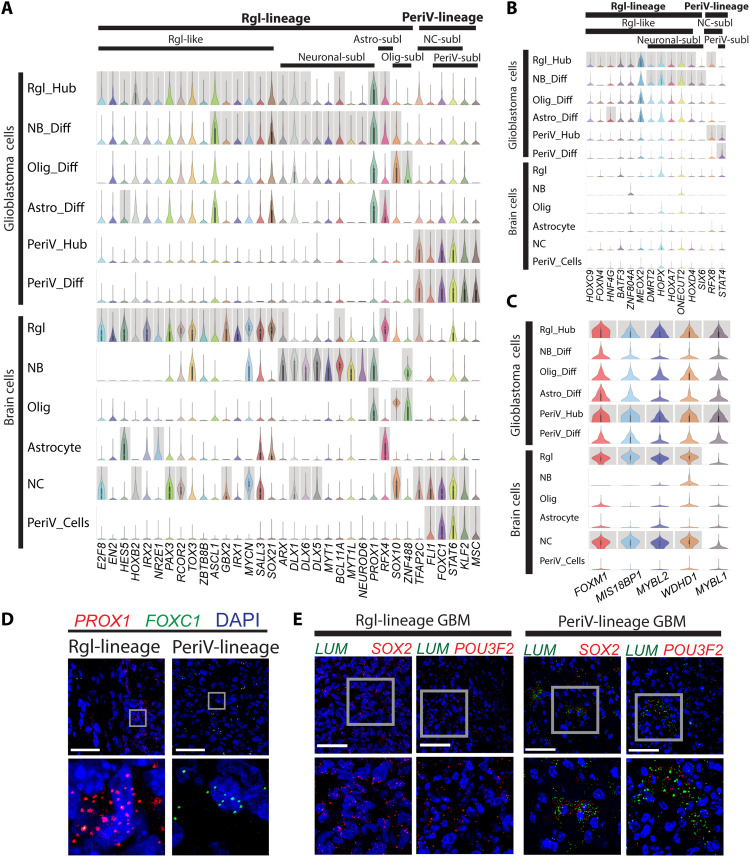
Fig. 4. Conserved TF signatures between naïve brain and neural crest cells with Rgl- and PeriV-lineage glioblastoma.
(A to C) Violin plot of TF expression shared between tumor cells and normal reference cell types (A), of TFs unique to glioblastoma cells (B), and of TFs shared between Rgl- and PeriV-lineage glioblastoma cells (C). y axis, the relative expression level; x axis, TF gene names. Cell types and lineages are indicated at the top of the chart. Gray columns represent the significantly differential expression. “Diff” indicates tumor cells at the distal differentiation of the sublineage trajectories and “Hub” indicates stem-like cells of the Rgl and perivascular lineages corresponding to native radial glia and neural crest cells, respectively. (D and E) Validation of PROX1 and FOXC1 mRNA expression in Rgl-lineage– and PeriV-lineage–type patient-derived glioblastoma xenografts, respectively (D). Validation of SOX2 and POU3F2 mRNA expression in both PeriV-lineage–type and Rgl-lineage–type patient-derived glioblastoma xenografts, LUM was used as a marker of PeriV-lineage tumor (E). Tumor lineage type and gene names are at the top. Each bottom figure is a higher magnification from the gray frame of the top figure. Scale bars, 50 μm.

