
FIGURE 2.
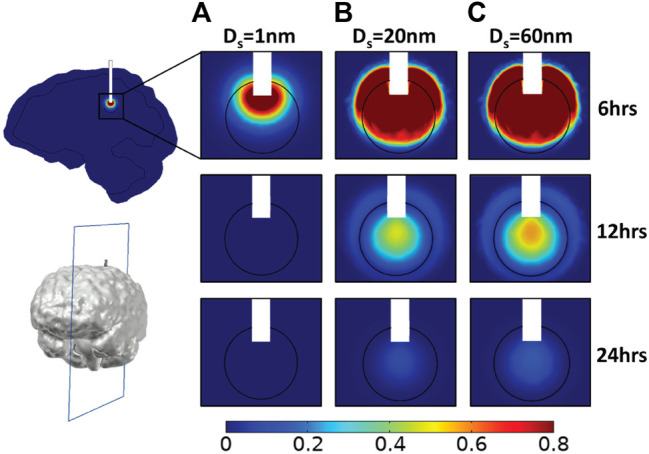
Simulated drug concentration using baseline tumor microenvironment conditions. A sagittal view in the center of tumor tissue showing the spatial distribution of drug concentration and for different diameters of the therapeutic agent, Ds: (A) 1 nm, (B) 20 nm, and (C) 60 nm at three time points: 6, 12, and 24 h. Drug concentration is normalized by division with the reference value entering the catheter.