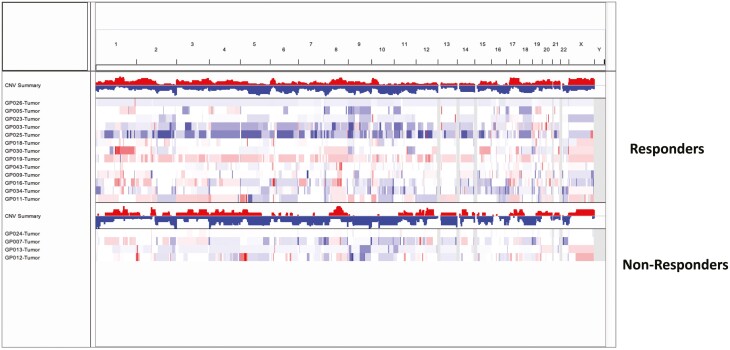
Figure 3.
A heatmap of the genome-wide copy number variation (CNV) profiles based on median log2ratio, stratified by response. Individual patient samples are shown along the y-axis with amplification events in red and loss events in blue. The number of CNV events at each genomic locus for responders and nonresponders are summarized as bar plots at the top for both responders and non-responders. Copy number segmentation profiles were qualitatively similar between responders and non-responders.

