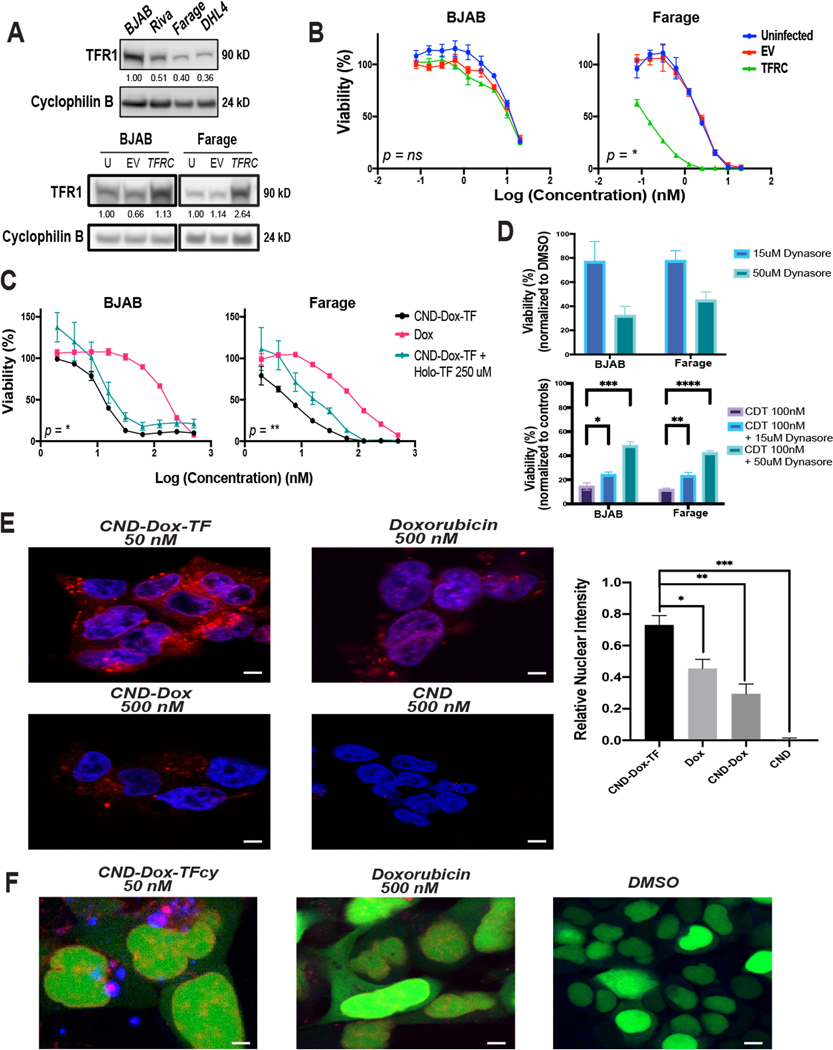
Figure 4. CND-Dox-TF mechanism of action.
A) Immunoblot analysis of TFR1 (90 kD) expression in DLBCL cell lines with cyclophilin B (24 kD) loading control (top) and BJAB and Farage cells infected and FACS sorted for TFRC overexpression (bottom). B) 48-hour cell viability assays corresponding to cell lines depicted in A plated in serial dilutions of CND-Dox-TF. Data shown are mean quadruplicate ±SEM with P values corresponding to Uninfected vs. TFRC EC50 values. C) 48-hour cell viability assay of BJAB and Farage cell lines plated in serial dilutions of Dox, CND-Dox-TF, CND-TF, and CND-Dox-TF + a constant 250 uM concentration of competitive holo-TF in each well. Data shown are mean quadruplicate ±SEM with P values corresponding to CND-Dox-TF vs. CND-Dox-TF + a constant 250uM holo-TF EC50 values. D) 48-hour viability response of BJAB and Farage cells treated with dynasore for 48-hours (top panel) and treated with CND-Dox-TF (100nM) + 15 uM or 50 uM dynasore for 48-hours (bottom panel). Shown are mean triplicate ±SEM. E) Fluorescent confocal microscopy images (60× objective) of HEK293 cells incubated for 24 hours with CND-Dox-TF (50 nM), CND (500 nM), CND-Dox (500 nM) or Dox (500 nM). Quantitation of overlap (mean triplicate ±SEM), right panel, of blue nuclear (DAPI) with red fluorescence from both Dox and CNDs. F) Fluorescent confocal microscopy images (63×) of HEK293 cells incubated for 24 hours with a Cyan-TF labeled CND-Dox-TF (50 nM), Doxorubicin (500 nM), and DMSO control. Green fluorescence corresponds to nucleus, blue corresponds to TF and red fluorescence corresponds to inherent signal emitted from Dox +/− CND. ****P < 0.0001; ***P < 0.001; **P < 0.01; *P < 0.05; ns, nonsignificant (t test). For densitometric analysis, all samples normalized to loading control first. Samples in A) top panel normalized to highest-expressing cell line BJAB. Samples in A) bottom panel normalized to uninfected basal condition cell line respectively. Scale bar 50 μm.

