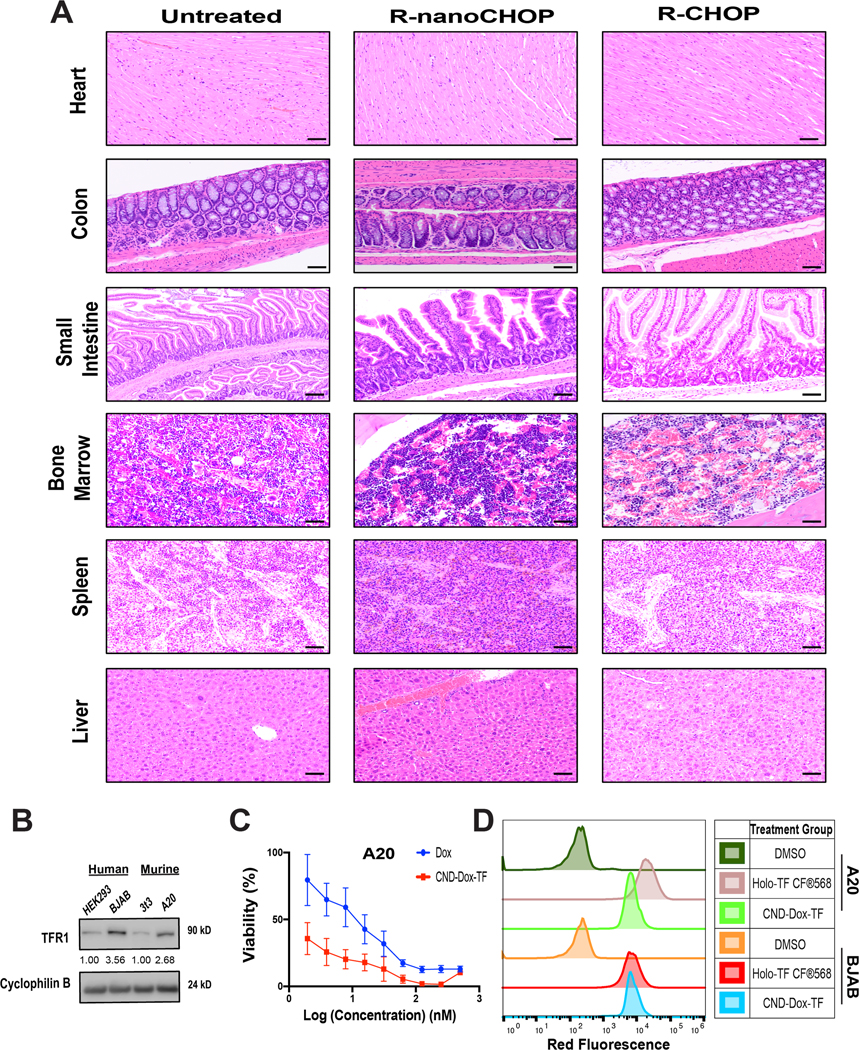
Figure 6. R-nanoCHOP treatment has favorable toxicity profile.

A) Heart, Colon, Small Intestine, Bone Marrow, Spleen, Liver H&E pathology collected from R-CHOP and R-nanoCHOP treated mice at predetermined survival endpoints. B) Immunoblot analysis of TFR1 (90 kD) expression in HEK293, BJAB, 3T3 and A20 cell lines. C) 48-hour viability assays for A20 cells plated in serial dilution of Dox and CND-Dox-TF. D) Flow cytometry binding assay of A20 and BJAB cells incubated for 30 minutes with DMSO, holo-TFCF®568, or CND-Dox-TF. Scale bar 50 μm (20× objective for all). For densitometric analysis, all samples normalized to loading control first followed by normalization to respective lower TFR1-expressing cell lines.
