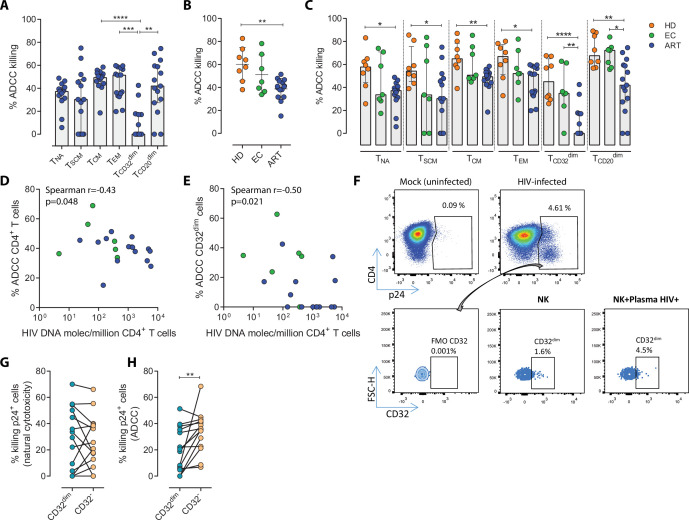
Figure 1. Susceptibility of CD4+ T cell subsets to the Natural Killer (NK) immune response.
The susceptibility of different cell subpopulations that compose the HIV-reservoir to Natural Cytotoxicity (NC) and Antibody-Dependent Cell Cytotoxicity (ADCC) mediated by NK cells was measured by performing functional assays. (A) Percentage of gp120-coated cells killed by ADCC after being exposed to HIV-specific immunoglobulins (Igs) in the presence of NK cells. The intrinsic susceptibility to ADCC was measured in Naïve (TNA), Stem Cell Memory (TSCM), Central Memory (TCM), Effector Memory (TEM), TCD32dim, and TCD20dim subsets. Statistical comparisons were performed using the ANOVA Friedman with Dunn’s multiple comparison test. Median with interquartile range is shown. (B) Percentage of total gp120-coated CD4+ T cells from different cohorts of patients killed by ADCC. Healthy donors (HD), Elite Controllers (EC), and antiretroviral-treated (ART) PLWH. Statistical comparisons were performed using one-way ANOVA with Tukey’s multiple comparison test. Median with interquartile range are shown. (C) Percentage of cell subsets killed by ADCC in cells from HD, EC, and ART. Statistical comparisons were performed using the one-way ANOVA with Tukey’s multiple comparison test. Median with interquartile range is shown. (D–E) Spearman correlations between the size of the HIV-reservoir measured as total HIV-DNA in samples from ART-suppressed PLWH, and the potency of autologous NK cells to kill (D) total CD4+ T cells or (E) TCD32dim cells by ADCC. (F) Representative flow cytometry gating strategy used to quantify HIV infection after ex vivo infection with BaL or NL4.3. Fluorescence minus one (FMO) control was used to determine CD32 expression. Cells were infected for 5 days and the frequency of expression of CD32 on HIV-infected cells was measured for each condition. (G) Percentage of killing by NC of ex vivo HIV-infected TCD32dim and TCD32− cells mediated by autologous NK cells from ART-treated PLWH (n=14). Killing was calculated by normalizing the proportion of each subset within the p24+ fraction in the co-culture condition to the basal condition. (H) Percentage of ADCC killing of ex vivo HIV-infected TCD32dim and TCD32− cells mediated by autologous NK cells from ART-treated PLWH (n=14). Killing was calculated by normalizing the proportion of each subset within the p24+ fraction in the co-culture condition with plasma to the co-culture without plasma. Statistical comparisons were performed using the Wilcoxon matched-pairs signed-rank test. *p<0.05; **p<0.01.


