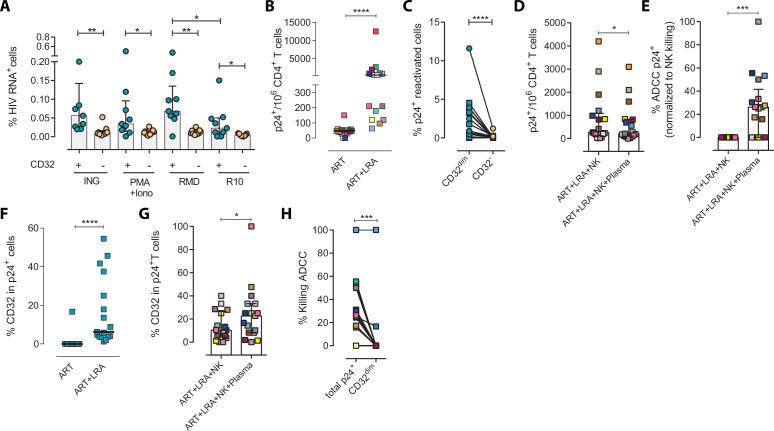
Figure 2. Expression of HIV in TCD32dim reservoir cells after latency disruption and susceptibility to natural killer (NK) immune responses.
Data from the direct ex vivo reactivation of the natural HIV reservoir in ART-suppressed PLWH. (A) Percentage of HIV-RNA expressing cells, measured by the RNA FISH-flow assay, within the TCD32dim and TCD32− subsets after viral reactivation with Ingenol, PMA/ionomycin, or romidepsin (n=9). Statistical comparisons were performed using the Wilcoxon matched-pairs signed-rank test (comparison between CD32dim and CD32− within each drug condition), and the ANOVA Friedman with Dunn’s multiple comparison test (comparison between different drug conditions of the cell subset). Median with interquartile range is represented. (B) Percentage of p24+ cells after 18 hr viral reactivation with PMA/ionomycin (n=17). Each participant is represented by a different color. Statistical comparisons were performed using the Wilcoxon matched-pairs signed-rank test. (C) Frequency of viral reactivation within the total pool of TCD32dim and TCD32− cells (n=17). Statistical comparisons were performed using the Wilcoxon matched-pairs signed-rank test. (D) NK killing assays against viral reactivated cells. Number of p24+ cells per million CD4+ T cells after the addition of NK cells only or together with the autologous plasma is shown (n=17). Statistical comparisons were performed using the Wilcoxon matched-pairs signed-rank test. (E) Percentage of ADCC in p24+ cells normalized to the NC control (ART + LRA + NK). Statistical comparisons were performed using one-sample t-test. (F) Percentage of CD32 expression within the total p24+ pool before and after HIV reactivation (n=17). Statistical comparisons were performed using the Wilcoxon matched-pairs signed-rank test. (G) Percentage of TCD32dim within p24+ cells after HIV reactivation and functional NK-mediated assays (n=17). Statistical comparisons were performed using the Wilcoxon matched-pairs signed-rank test. (H) Percentage of NK-mediated killing by ADCC of the reactivated TCD32dim or total p24+ cells (n=17). ADCC was calculated as the reduction of p24+ cells after the co-culture with NK and plasma and normalized to the condition with NK cells alone. Statistical comparisons were performed using the Wilcoxon matched-pairs signed-rank test. *p<0.05; **p<0.01; ***p<0.001.


