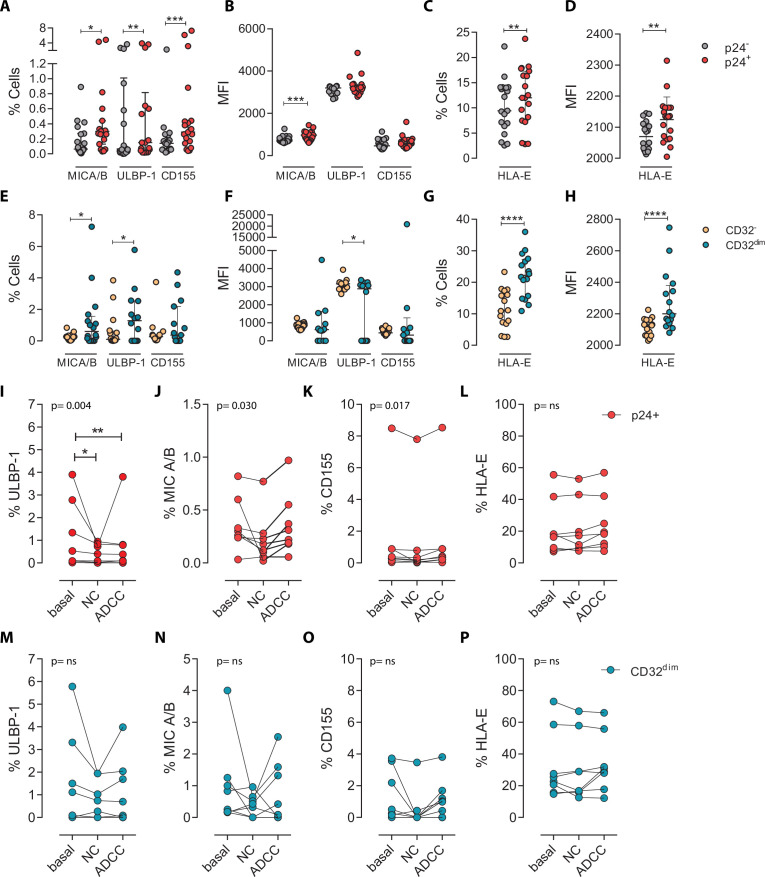
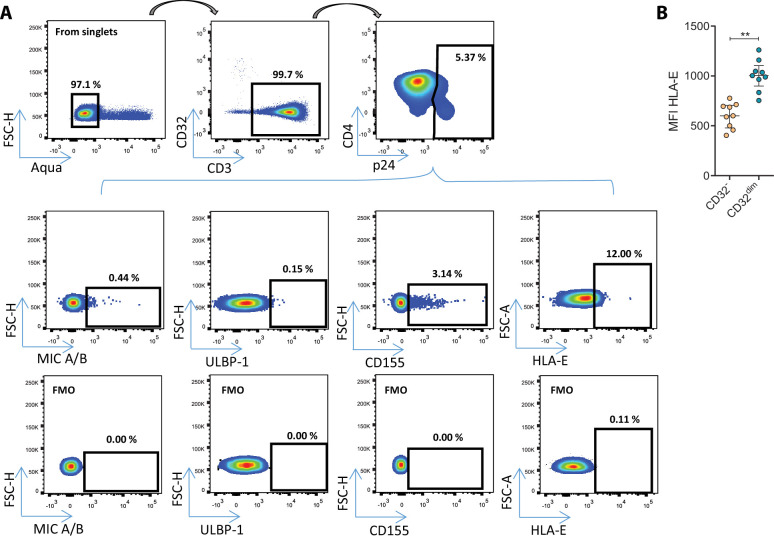
Figure 3. Expression of NK-ligands in cells resistant to NK-mediated killing.
HIV-infected cells from healthy donors were subjected to NK-killing assays and the percentage of expression of different NK-ligands was measured by flow cytometry in different fractions (CD32− and CD32dim) of infected (p24+) or uninfected (p24−) cells. (A–H) Expression of NK-ligands before performing the killing assays (n=19). (A) Percentage of CD4+ T cells expressing MIC A/B, ULBP-1, and CD155. (B) Mean Fluorescence Intensity (MFI) values for the expression of MIC A/B, ULBP-1, and CD155 on CD4+ T cells. (C) Percentage of CD4+ T cells expressing the MHC molecule HLA-E. (D) MFI values for HLA-E expression on CD4+ T cells. All graphs show median with interquartile range and the statistical comparisons were performed using the Wilcoxon matched-pairs signed-rank test (comparison between p24+ and p24−). (E–H) Same analyses as A–D but showing HIV-infected CD32dim and CD32- cells. (I–P) Expression of NK-ligands on HIV-infected cells not killed by the different NK-killing mechanisms. Natural Cytotoxicity (NC) and Antibody-Dependent Cell Cytotoxicity (ADCC). (I–L) Expression of NK-ligands on total infected CD4+ T cells before and after NK killing. (M–P) Expression of NK-ligands on infected TCD32dim cells before and after NK killing. All I-P graphs show median with interquartile range. p values shown in the graphs represent ANOVA Friedman test, and asterisks denote the multiple comparison Dunn’s test.*p<0.05; **p<0.01; ***p<0.001; ****p<0.0001.


