. 2022 May 30;11:e73693. doi: 10.7554/eLife.73693

Figure 2. Consistent activation patterns associated with between-movie boundaries.

(A) Schematic of the pattern similarity analysis. Boundary patterns were defined as the mean pattern averaged across 15 s following the offset of each watched or recalled movie. Non-boundary patterns were defined as the mean pattern averaged across 15 s in the middle of each watched or recalled movie. For each subject and cortical parcel (Schaefer et al., 2018; 200 parcels per hemisphere), we computed pairwise between-movie pattern similarity (Pearson correlation), separately for boundary patterns and non-boundary patterns measured during recall (a and b, blue arrows). We also computed between-movie and between-phase (encoding-recall) pattern similarity, again separately for boundary and non-boundary patterns (c and d, red arrows). The time windows for both boundary and non-boundary periods were shifted forward by 4.5 s to account for the hemodynamic response delay. (B) Whole-brain t statistic map of cortical parcels that showed consistent between-movie boundary patterns during recall. These parcels displayed significantly greater between-movie pattern similarity in the boundary condition compared to the non-boundary condition during recall. The map was masked by parcels that showed significantly positive between-movie pattern similarity in the boundary condition during recall. Both effects were Bonferroni corrected across parcels (p<0.05). (C) Whole-brain t statistic map of cortical parcels that showed consistent between-movie boundary patterns across encoding and recall. These parcels displayed significantly greater between-movie and between-phase pattern similarity in the boundary condition compared to the non-boundary condition. The map was masked by parcels that showed significantly positive between-movie and between-phase pattern similarity in the boundary condition. Both effects were Bonferroni corrected across parcels (p<0.05).

Figure 2.

Figure 2—figure supplement 1. Consistent activation patterns during shorter (4.5 s) time windows following between-movie boundaries.

Figure 2—figure supplement 1.

(A) Whole-brain t statistic map of cortical parcels that showed consistent between-movie boundary patterns during recall. These parcels displayed significantly greater between-movie pattern similarity in the boundary condition compared to the non-boundary condition during recall. The map was masked by parcels that showed significantly positive between-movie pattern similarity in the boundary condition during recall. Both effects were Bonferroni corrected across parcels (p<0.05). (B) Whole-brain t statistic map of cortical parcels that showed consistent between-movie boundary patterns across encoding and recall. These parcels displayed significantly greater between-movie and between-phase pattern similarity in the boundary condition compared to the non-boundary condition. The map was masked by parcels that showed significantly positive between-movie and between-phase pattern similarity in the boundary condition. Both effects were Bonferroni corrected across parcels (p<0.05). For both (A) and (B), boundary periods were defined as 4.5–9 s from the offset of each movie. Non-boundary periods were defined as the middle 4.5 s of each movie, shifted forward by 4.5 s to account for hemodynamic response delay.

Figure 2—figure supplement 2. Similar visual input cannot explain between-movie boundary patterns consistent across experimental phases.
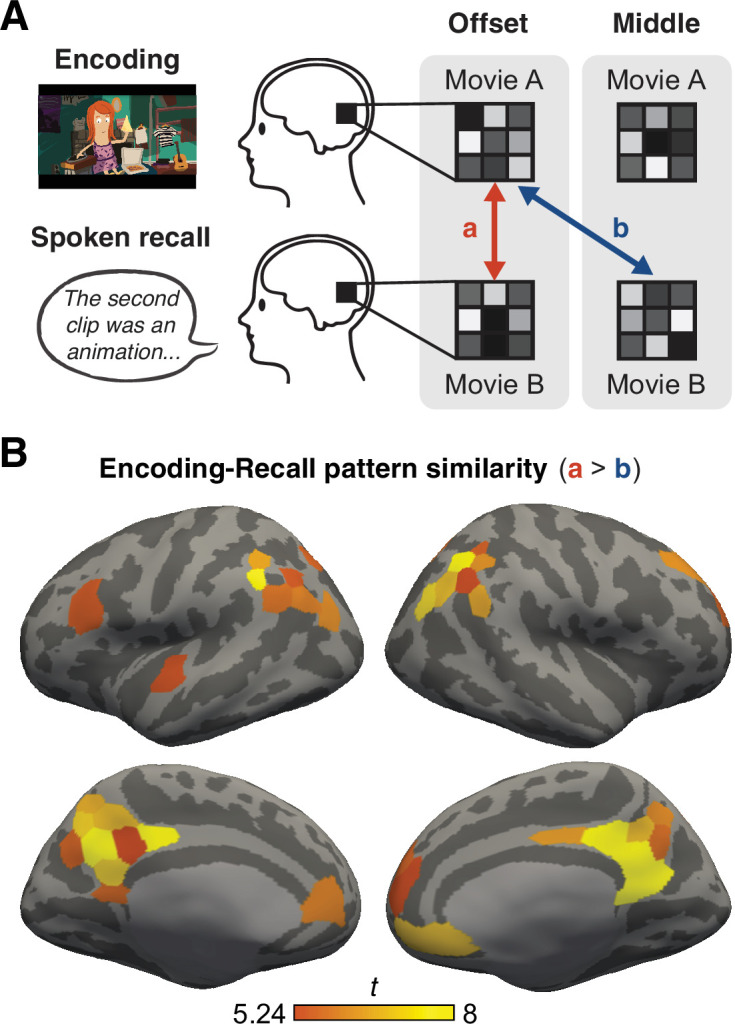
Figure 2—figure supplement 2.

(A) To test whether shared visual features (i.e., mostly blank black screen) produced boundary (offset) patterns consistent across encoding and recall, we performed a whole-brain pattern similarity analysis. For each subject and cortical parcel, we computed the mean correlation between boundary patterns across different movies and experimental phases (a, red arrow). We also computed the mean correlation between encoding boundary patterns and recall non-boundary (middle) patterns across different movies (c, blue arrow). Note that visual input (a fixation dot) was identical across boundary and non-boundary periods during recall. The duration of boundary and non-boundary periods was 15 s. (B) Whole-brain t statistic map of cortical parcels that showed greater pattern correlations between encoding and recall boundary patterns (a, red arrow) compared to correlations between encoding boundary patterns and recall non-boundary patterns (c, blue arrow). Bonferroni correction was applied across parcels to correct for multiple comparisons (p<0.05). Several parcels in higher associative cortices showed greater correlations between encoding and recall boundary patterns, suggesting that low-level visual features contributed little to the consistent boundary patterns in those areas.