. 2022 May 30;11:e73693. doi: 10.7554/eLife.73693

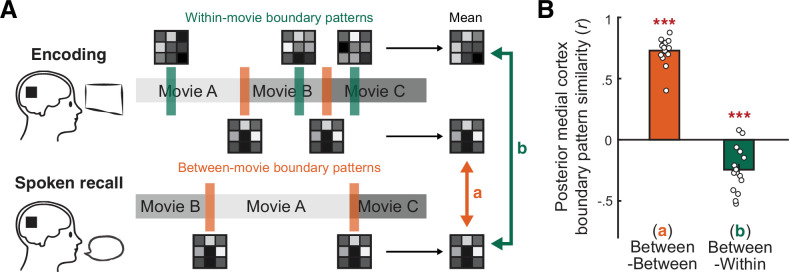
Figure 4. Comparing between-movie and within-movie boundary patterns in the posterior medial cortex (PMC).

(A) Schematic of the analysis. For each subject, we created the template PMC activation pattern associated with between-movie boundaries by averaging activation patterns following the offset of each between-movie boundary (orange bars), separately for encoding and recall phases. Likewise, the template within-movie event boundary pattern was created by averaging the activation patterns following the offset of each within-movie boundary during encoding (green bars). We then measured the similarity (Pearson correlation) between the mean between-movie boundary patterns during encoding and recall (a, orange arrow). We also measured the similarity between the mean within-movie boundary pattern during encoding and the mean between-movie boundary pattern during recall (b, green arrow). For both between- and within-movie boundaries, boundary periods were 15 s long, shifted forward by 4.5 s. (B) Pattern similarity between template boundary patterns. The orange bar shows the mean correlation across the between-movie boundary patterns during encoding and recall. The green bar shows the mean correlation across the between-movie boundary pattern during recall and the within-movie boundary pattern during encoding. Circles represent individual subjects. Error bars show SEM across subjects. ***p<0.001 against zero.

Figure 4—source data 1. Source data for Figure 4.

Figure 4.

Figure 4—figure supplement 1. Comparing within-movie boundary patterns and non-boundary (middle) patterns in the posterior medial cortex (PMC) during encoding.

Figure 4—figure supplement 1.

The mean correlation between within-movie boundary patterns across different movies (within-within) was greater than zero (t(14) = 5.23, p<0.001, Cohen’s dz = 1.35, 95% CI = [0.03,0.07]). The mean correlation between within-movie boundary patterns and non-boundary patterns across different movies (within-middle) was also greater than zero (t(14) = 3.73, p=0.002, Cohen’s dz = .96, 95% CI = [0.01,0.02]). Critically, within-movie boundary patterns were more similar to each other than to non-boundary patterns (within-within vs. within-middle; t(14) = 3.29, p=0.005, Cohen’s dz = .85, 95% CI of the difference = [0.01,0.06]). The duration of within-movie boundary and non-boundary periods was 15 s. Two non-boundary patterns that partially overlapped with the within-movie boundary patterns were excluded from analysis. Circles represent individual subjects. Error bars show SEM across subjects. **p<0.01, ***p<0.001.
Figure 4—figure supplement 1—source data 1. Source data for Figure 4—figure supplement 1.

Figure 4—figure supplement 2. Examining the effects of boundary period time windows on the between- and within-movie boundary pattern similarity in the posterior medial cortex (PMC).

Figure 4—figure supplement 2.

(A) Pattern similarity between the template boundary patterns in PMC measured during a shorter (4.5 s) boundary period time window following the offset of each boundary. The orange bar shows the average correlation across the mean between-movie boundary patterns during encoding and recall. The green bar shows the average correlation across the mean between-movie boundary pattern during recall and the mean within-movie event boundary pattern during encoding. There was a strong positive correlation across the encoding and recall between-movie boundary patterns (t(14) = 15.08, p<0.001, Cohen’s dz = 3.89, 95% CI = [0.52,0.69]), whereas no such correlation was observed across the within- and between-movie boundary patterns (t(14) = 1.26, p=0.23, Cohen’s dz = .32, 95% CI = [–0.26,0.07]). Circles represent individual subjects. Error bars show SEM across subjects. ***p<0.001 against zero. (B) PMC pattern correlations across time points around between-movie boundaries during recall and within-movie event boundaries during encoding. The time series of activation patterns were locked to the offset of a movie or a prominent within-movie event. The correlations were first calculated within each subject and then averaged across all subjects. Time zero corresponds to the true stimulus/behavior time, with no shifting for hemodynamic response delay. Areas outlined by black lines indicate correlations that significantly deviate from zero after multiple comparisons correction (Bonferroni corrected p<0.05). No significant positive correlations were observed across encoding and recall immediately following the within- and between-movie boundaries.
Figure 4—figure supplement 2—source data 1. Source data for Figure 4—figure supplement 2.