. 2022 May 30;11:e73693. doi: 10.7554/eLife.73693

Figure 5. Examining the effects of silence on the generalized boundary pattern.

For each subject, we computed a Pearson correlation between the mean activation pattern of the moments of silence during encoding (blue bars) and the mean activation pattern of between-movie boundaries during recall (orange bar) in the posterior medial cortex (PMC) and the auditory cortex (AUD). The moments of silence near between-movie boundaries (i.e., within the first 45 s of each movie) during encoding were excluded from the analysis. PMC and AUD regions of interest are shown as white areas on the inflated surface of template brains. Gray bars on the right panel indicate the mean pattern similarity across subjects. Circles represent individual subjects. Error bars show SEM across subjects. ***p<0.001 against zero.
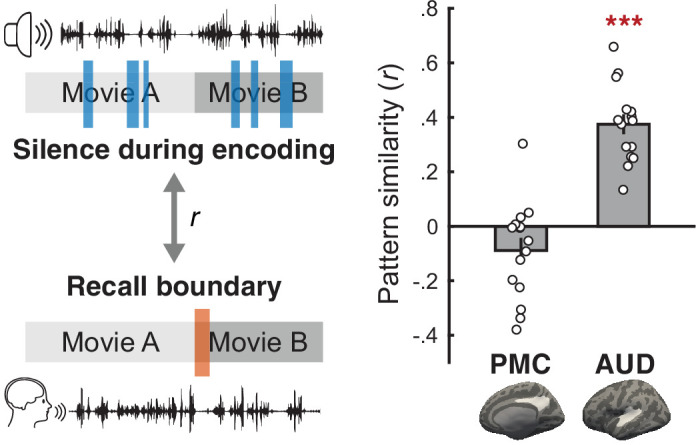
Figure 5—source data 1. Source data for Figure 5.

Figure 5.

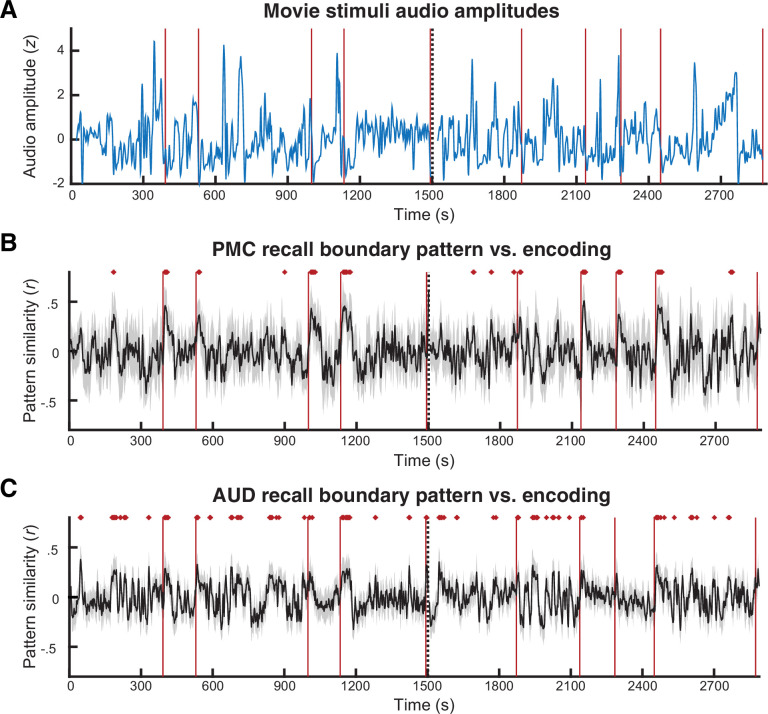
Figure 5—figure supplement 1. Time series of audio amplitudes during encoding and the similarity to the recall boundary pattern.

Figure 5—figure supplement 1.

(A) Audio amplitudes of the movie stimuli. The audio amplitudes were convolved with a hemodynamic response function and z-scored across time points. (B) Posterior medial cortex (PMC) pattern similarity (Pearson correlation) between each volume of encoding data and the template between-movie boundary pattern measured during recall (average of 4.5–19.5 s from the offset of each recalled movie). (C) Auditory cortex (AUD) pattern similarity between each volume of encoding data and the template between-movie boundary pattern measured during recall. In (AC), the vertical dotted line in the middle indicates the boundary between the two encoding scanning runs. Vertical red lines indicate the offsets of each movie clip. In (B) and (C), black lines show the mean across subjects. Shaded areas indicate the standard deviation across subjects. Red dots mark time points that showed significantly positive pattern correlations after multiple comparisons correction across time points (Bonferroni corrected p<0.05).
Figure 5—figure supplement 1—source data 1. Source data for Figure 5—figure supplement 1.

Figure 5—figure supplement 2. Relationship between audio amplitudes during encoding and the similarity to the recall boundary pattern.

Figure 5—figure supplement 2.

We computed correlations between the time series of audio amplitudes and the time series of similarity between the recall boundary pattern and each volume of encoding data in the posterior medial cortex (PMC) and the auditory cortex (AUD). Time points within each of the 10 movies after excluding the first 45 s were included in the analysis. PMC correlations were not significantly different from zero (t(14) = 1.7, p=0.11, Cohen’s dz = 0.44, 95% CI = [–0.04,0.004]), whereas AUD showed significantly negative correlations (t(14) = 18.66, p<0.001, Cohen’s dz = 4.82, 95% CI = [–0.26, –0.21]). Bar graphs show the mean across subjects. Circles represent individual subjects. Error bars show SEM across subjects. ***p<0.001 against zero.
Figure 5—figure supplement 2—source data 1. Source data for Figure 5—figure supplement 2.