
Figure 3. Structural differences in ribosomes upon methylation at His245.
(A) Stick models of 244GHR246 of RPL3 and G1595 of the 28S rRNA of the human ribosome are shown with the cryo-electron microscopy (cryo-EM) density map around His245. The τ-N-methyl group was manually added to the original model (PDB ID: 6Y6X) (Osterman et al., 2020) based on the cryo-EM density map. (B) The same model as in (A) of human ribosome from METTL18 knockout (KO) cells. A hydrogen bond between His245 and G1595 is indicated with a dotted blue line.
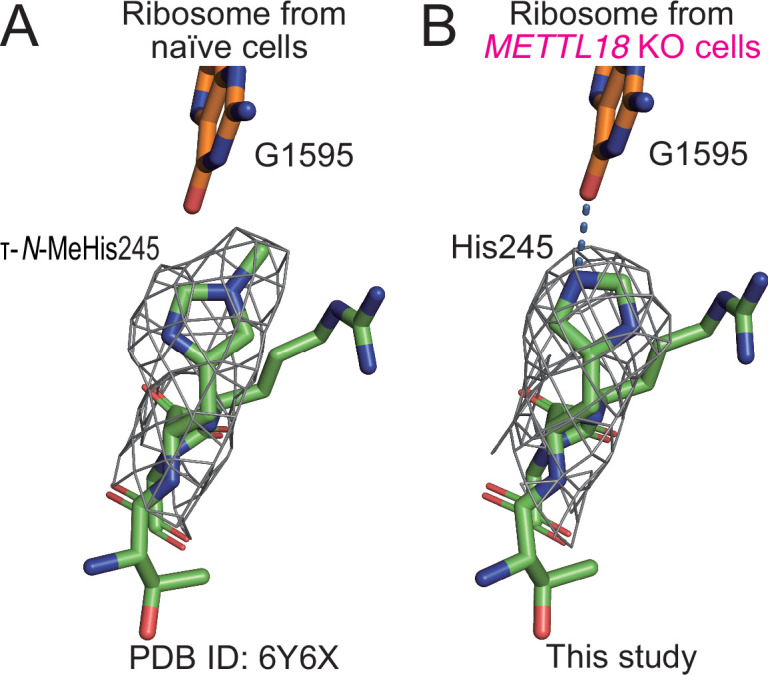
Figure 3—figure supplement 1. Ribosome subunit ratio in METTL18 cells.

(A) Electropherogram of ribosomal RNAs from naïve and METTL18 knockout (KO) HEK293T cells. Data from two replicates are shown. (B, C) Sucrose density gradient for ribosomal complexes from naïve and METTL18 KO HEK293T cells (B) and the quantification (C). The lysate was prepared with a buffer containing EDTA to dissociate 80S into 40S and 60S. In (C), data from three replicates (points) and the mean (bar) with SD (error bar) are shown. (D) Western blot of the indicated proteins to confirm the knockdown of RPL17. β-Actin was probed for as a loading control. (E, F) Sucrose density gradient for ribosomal complexes from control siRNA (siControl) and RPL17 siRNA (siRPL17)-transfected cells (E) and the quantification (F). The lysate was prepared with a buffer containing EDTA to dissociate 80S into 40S and 60S. In (F), data from three replicates (points) and the mean (bar) with SD (error bar) are shown. Significance was determined by Student’s t-test (unpaired, two-sided).
Figure 3—figure supplement 1—source data 1. Full and unedited blots corresponding to Figure 3—figure supplement 1D.
elife-72780-fig3-figsupp1-data1.tif (2.5MB, tif)
Figure 3—figure supplement 1—source data 2. Primary data for graphs in Figure 3—figure supplement 1C and F.
elife-72780-fig3-figsupp1-data2.xlsx (10.6KB, xlsx)
Figure 3—figure supplement 2. Characterization of the structure of the 60S subunit from METTL18 knockout (KO) cells.

(A) Representative cryo-electron microscopy (cryo-EM) micrographs of human ribosomes isolated from METTL18 KO cells. (B) Flow of the cryo-EM structural analysis of the human 60S subunit from METTL18 KO cells. (C) Resolution curves of the reconstituted cryo-EM structure of the human 60S subunit from METTL18 KO cells.