. 2022 Jun 8;11:e72780. doi: 10.7554/eLife.72780

Figure 4. Ribosome profiling reveals Tyr codon-specific translation retardation by RPL3 methylation.

(A) Ribosome occupancy at A-site codons in naïve and METTL18 knockout (KO) HEK293T cells. Data were aggregated into codons with each amino acid species. (B) Ribosome occupancy changes at A-site codons caused by METTL18 KO. (C) Histogram of ribosome occupancy changes in METTL18 KO cells across motifs around A-site codons (seven amino acid motifs). Cyan: motifs with reduced ribosome occupancy (defined by ≤ mean – 2 SD). (D) Amino acid motifs associated with reduced ribosome occupancy in METTL18 KO cells (defined in C) are shown relative to the A-site (at the 0 position). (E) Distribution of footprint length in naïve and METTL18 KO HEK293T cells. (F) Ribosome occupancy changes on Tyr codons by METTL18 KO along all, long (28–33 nt), and short (20–24 nt) footprints. Significance was determined by the Mann–Whitney U-test. (G) The recovery of long footprint reduction in METTL18 KO cells by ectopic expression of METTL18 protein. Significance was determined by the Mann–Whitney U-test. (H) Changes in ribosome occupancy on Tyr codons by METTL18 KO in HAP1 cells along long (28–33 nt) footprints. Del., deletion. In (A–C) and (E–H), the means of two independent experiments are shown.

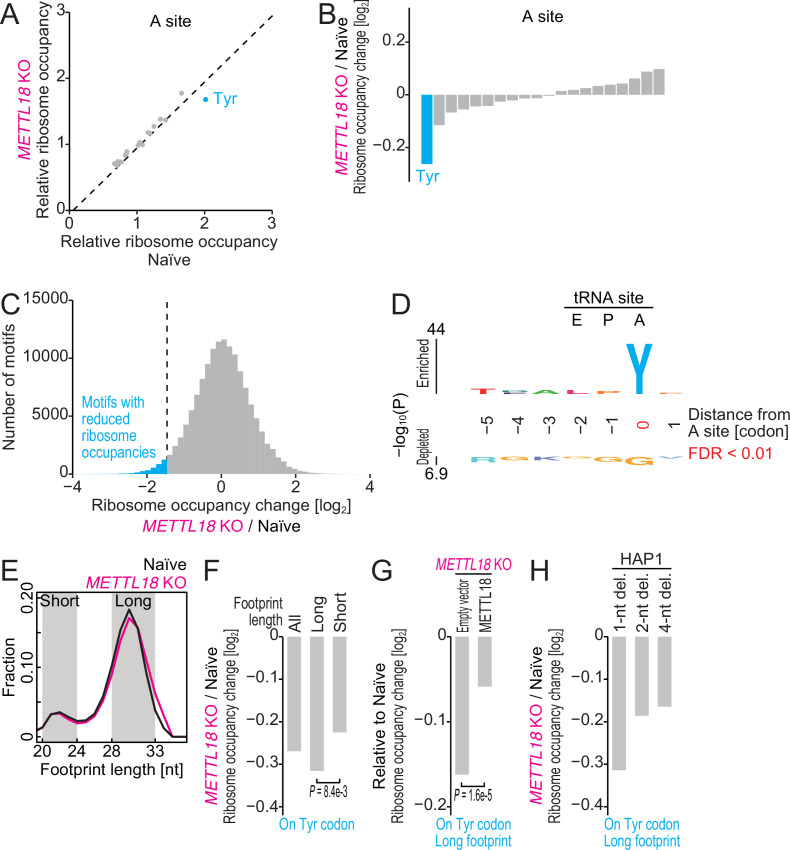
Figure 4.

Figure 4—figure supplement 1. Basal translation activity in METTL18 cells.

Figure 4—figure supplement 1.

(A, B) Sucrose density gradient for ribosomal complexes from naïve and METTL18 knockout (KO) HEK293T cells (A) and the quantification (B). The 80S ribosome and polysomes were stabilized by Mg ion and cycloheximide. In (B), data from three replicates (points) and the mean (bar) with SD (error bar) are shown. (C, D) Sucrose density gradient for ribosomal complexes from control siRNA (siControl)- and RPL17 siRNA (siRPL17)-transfected cells (C) and the quantification (D). 80S and polysomes were stabilized by Mg ion and cycloheximide. In (D), data from three replicates (points) and the mean (bar) with SD (error bar) are shown. Significance was determined by Student’s t-test (unpaired, two-sided). (E) Newly synthesized proteins in naïve and METTL18 KO HEK293T cells were labeled with OP-puro and then conjugated with infrared 800 (IR800) dye with a click reaction. The signal was normalized to total proteins stained with Coomassie brilliant blue (CBB). Data from three replicates (points) and the mean (bar) with SD (error bar) are shown.
Figure 4—figure supplement 1—source data 1. Primary data for graphs in Figure 4—figure supplement 1B, D, and E.
Figure 4—figure supplement 2. Characterization of ribosome occupancy monitored by ribosome profiling.

Figure 4—figure supplement 2.

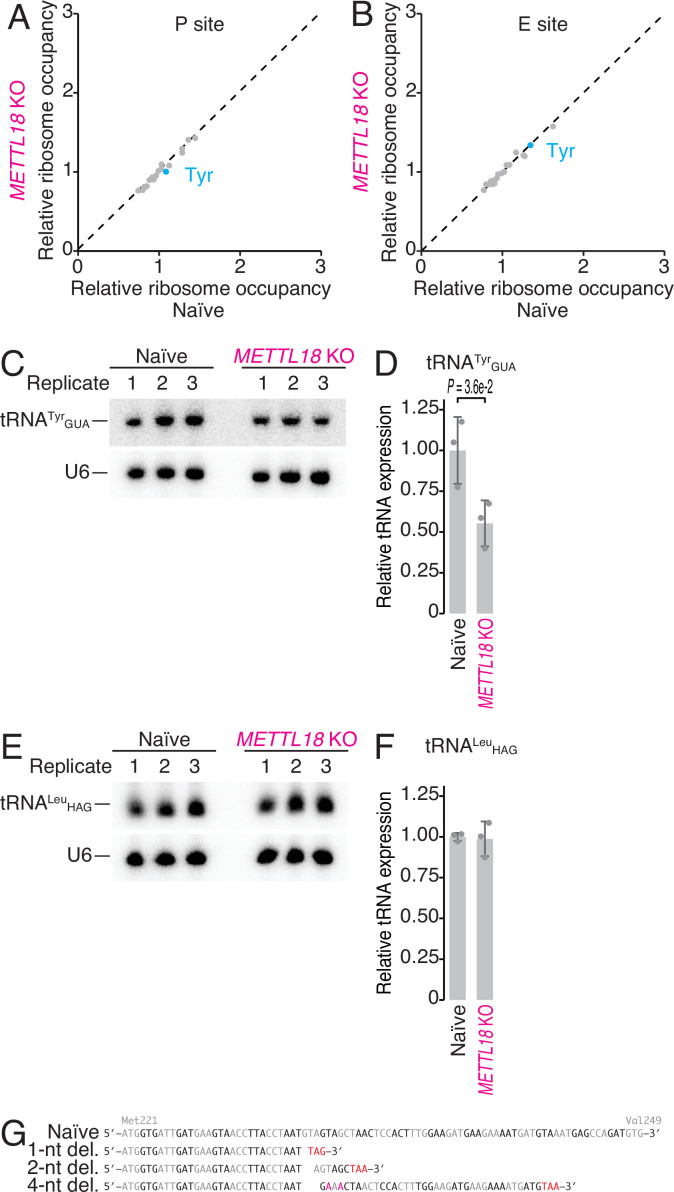
(A, B) Ribosome occupancy at P-site (A) and E-site (B) codons. Data were aggregated into codons with each amino acid species. The means of two independent experiments are shown. (C, D) Northern blot for tRNATyrGUA (C) and its quantification (D). U6 snRNA was used as loading control. In (D), data from three replicates (points) and the mean (bar) with SD (error bar) are shown. Significance was determined by Student’s t-test (unpaired, two-sided). (E, F) Same as (C) and (F) but for tRNALeuHAG. In (F), data from three replicates (points) and the mean (bar) with SD (error bar) are shown. H stands for A, C, or U. (G) Schematic representation of mutations in METTL18 KO HAP1 cells. Del., deletion.
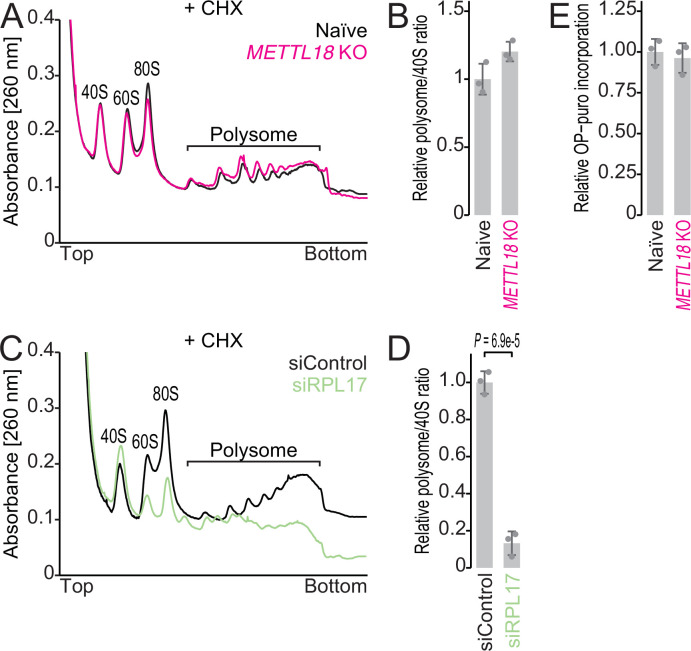
Figure 4—figure supplement 2—source data 1. Full and unedited blots corresponding to Figure 4—figure supplement 2C.
Figure 4—figure supplement 2—source data 2. Full and unedited blots corresponding to Figure 4—figure supplement 2E.
Figure 4—figure supplement 2—source data 3. Primary data for graphs in Figure 4—figure supplement 2D and F.