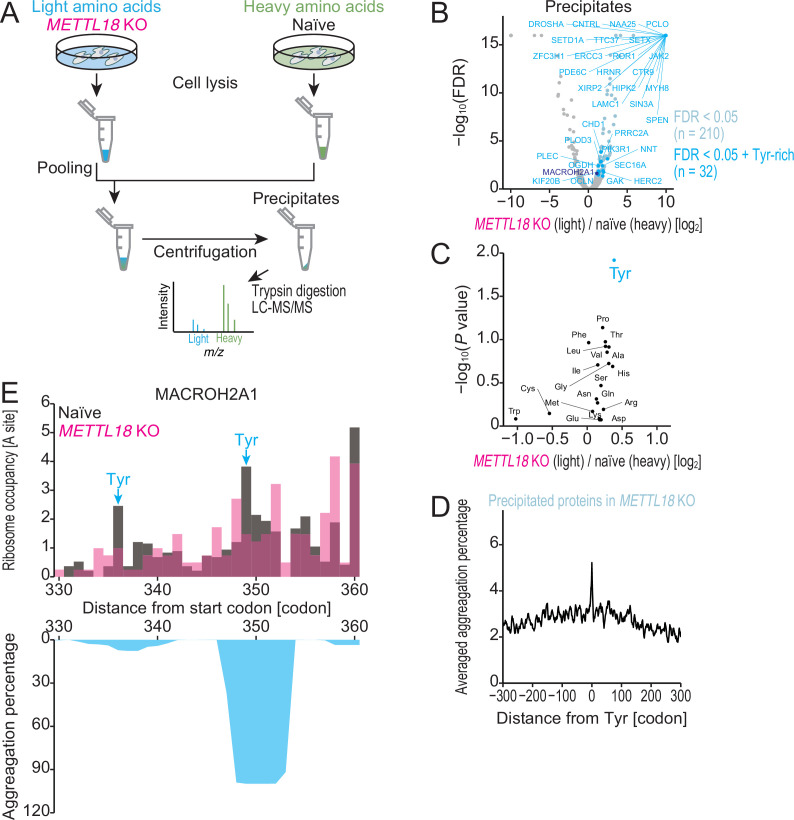
Figure 7. METTL18 deletion aggregates Tyr-rich proteins.
(A) Schematic representation of SILAC-MS for precipitated proteins. (B) Volcano plot for precipitated proteins in METTL18 knockout (KO) cells, assessed by SILAC-MS (n = 2). Tyr-rich proteins were defined as proteins with 30 or more Tyr residues. (C) Amino acids associated with protein precipitation in METTL18 KO cells. Precipitated proteins enriched with each amino acid were compared to the total precipitated proteome. The mean fold change and the significance (Mann–Whitney U-test) were plotted. (D) Metagene plot for aggregation percentage, calculated with TANGO (Fernandez-Escamilla et al., 2004), around Tyr codons of precipitated proteins in METTL18 KO cells (defined in B). (E) Distribution (at the A-site) of ribosome footprint occupancy (the mean of two independent experiments) along the MACROH2A1 gene in naïve (gray) and METTL18 KO (magenta) HEK293T cells, depicted with the aggregation percentage (light blue) calculated by TANGO (Fernandez-Escamilla et al., 2004). Tyr codon positions are highlighted with arrows.


