. 2022 Jun 8;11:e72780. doi: 10.7554/eLife.72780

Figure 9. Schematic representation of METTL18-mediated control of translation and proteostasis.

METTL18 adds a methyl moiety at the τ-N position of His245 in RPL3 in the form of an early 60S biogenesis intermediate. Methylated ribosomes slow elongation at Tyr codons and extend the duration of nascent peptide folding, ensuring proteostatic integrity. Without RPL3 methylation, the accumulation of unfolded and ultimately aggregated proteins in cells was induced.
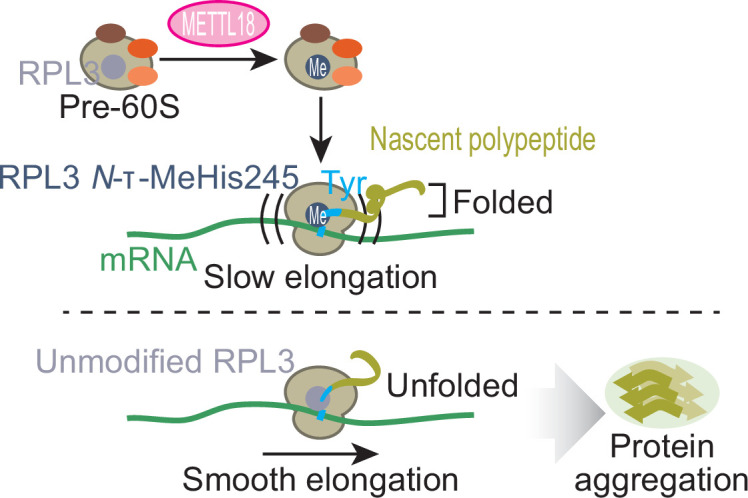
Figure 9.

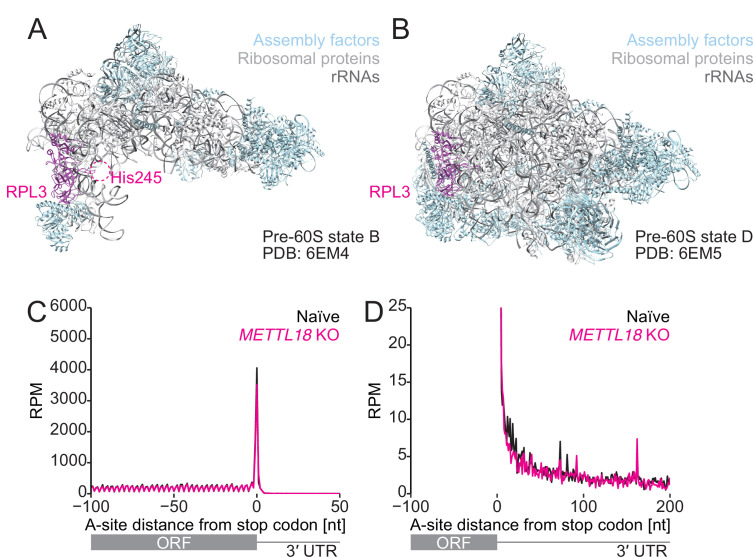
Figure 9—figure supplement 1. Comparison of the structure of the early and late pre-60S as a possible RPL3 methylation target.

Figure 9—figure supplement 1.

(A, B) Structures of early (state B, PDB 6EM4:) and late (state D, PDB: 6EM5) pre-60S (Kater et al., 2017). A possible region of the protein fragment containing His245 in RPL3 is highlighted in a dashed circle. RPL3, magenta; assembly factor, light blue; ribosomal proteins, light gray; rRNA, dark gray. (C, D) Metagene analysis of ribosome footprints around the stop codon. A-site potion of footprints is depicted. In (D), a zoomed-in view of the plot is shown. The mean of two independent experiments is shown.
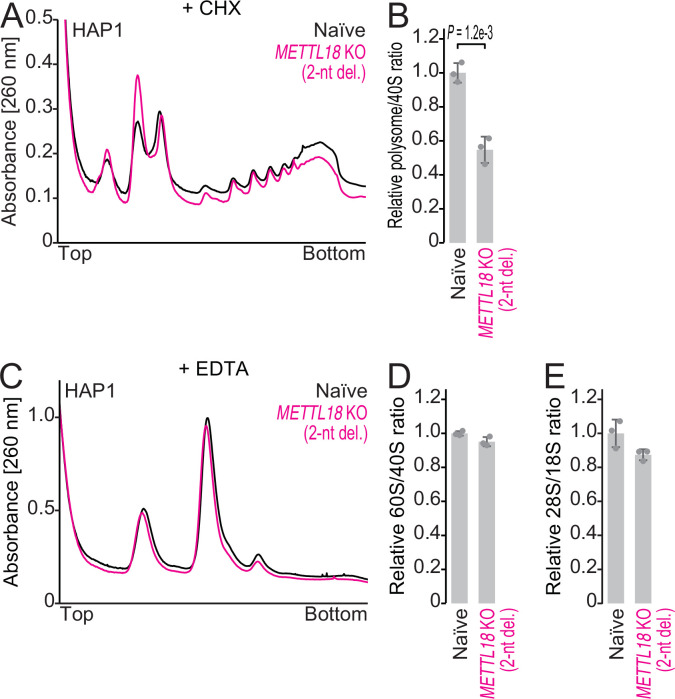
Figure 9—figure supplement 2. The impacts of METTL18 deletion in HAP1 cells on ribosomal complex formation.

Figure 9—figure supplement 2.

(A, B) Sucrose density gradient for ribosomal complexes from naïve and METTL18 knockout (KO) (2-nt del.) HAP1 cells (A) and the quantification (B). 80S and polysomes were stabilized by Mg ion and cycloheximide. In (B), data from three replicates (points) and the mean (bar) with SD (error bar) are shown. Significance was determined by Student’s t-test (unpaired, two-sided). (C, D) Sucrose density gradient for ribosomal complexes from naïve and METTL18 KO (2-nt del.) HAP1 cells (C) and the quantification (D). The lysate was prepared with a buffer containing EDTA to dissociate 80S into 40S and 60S. In (D), data from three replicates (points) and the mean (bar) with SD (error bar) are shown. (E) Quantification of ribosomal RNAs from naïve and METTL18 KO (2-nt del.) HAP1 cells by fragment analyzer. Data from three replicates (points) and the mean (bar) with SD (error bar) are shown.
Figure 9—figure supplement 2—source data 1. Primary data for graphs in Figure 9—figure supplement 2B, D, and E.