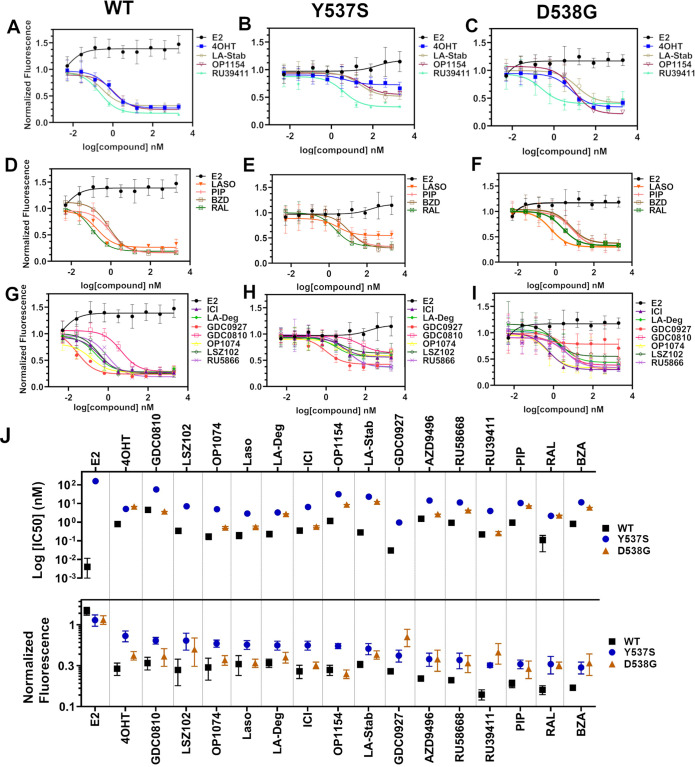
Figure 5. Transcriptional reporter gene assays in MCF7 cells with WT, WT/Y537S, and WT/D538G ESR1.
Selective estrogen receptor modulators (SERMs) in (A) WT, (B) WT/Y537S, and (C) WT/D538G MCF7 cells. SERM/selective estrogen receptor degraders/downregulators (SERDs) in (D) WT, (E) WT/Y537S, (F) WT/D538G MCF7 cells. SERDs in (G) WT, (H) WT/Y537S, and (I) WT/D538G MCF7 cells. (J) Summary of IC50 and normalized fluorescence at 5 μM compound after 24 hr for each compound. Data are ordered from left to right based on normalized fluorescence at highest dose in Y573S MCF7. Poor IC50 fits were omitted. Data are shown as the mean of two biologic replicates ± SD. All data are normalized to cell count in their respective wells.

