. 2022 May 26;11:e75166. doi: 10.7554/eLife.75166

Figure 1. Cryopyrin-associated periodic syndrome-associated NLRP3 mutants form cryo-sensitive foci.

(A) EF1-NLRP3-WT-, NLRP3-L353P-, or NLRP3-D303N-mNeonGreen-HeLa cells or EF1-ASC-GFP-HeLa cells were analyzed by confocal microscopy. Line profiles of foci or specks in the images were analyzed. (B and C) ASC KO/EF1-NLRP3-WT- or NLRP3-D303N-mNeonGreen-THP-1 cells were differentiated with 200 nM phorbol-12-myristate-13-acetate for 24 hr and then treated with nigericin for 6 hr. (B) Representative images by confocal microscopy. (C) The number of foci was counted by high-content analysis. (D–F) Differentiated ASC KO/EF1-NLRP3-WT-, NLRP3-L353P-, or NLRP3-D303N-mNeonGreen-THP-1 cells were cultured at 37 or 32°C for 24 hr. (G–I) EF1-NLRP3-WT-, NLRP3-L353P-, NLRP3-D303N-, NLRP3-Y563N-, or NLRP3-Y570C-mNeonGreen-HeLa cells were cultured at 37 or 32°C for 24 hr. (D and G) Representative images by confocal microscopy. (E, F, H, and I) The number of foci and the fluorescence intensity of the cells were analyzed by high-content analysis. Pearson correlation coefficients are shown. (J) EF1-ASC-GFP-HeLa cells were cultured at 37 or 32°C for 24 hr. The number of nuclei and speck was counted. (C, F, I, and J) Data are expressed as the mean ± SD. ***p<0.005 as determined by two-way ANOVA with a post hoc test. Data are representative of three independent experiments. WT, wild type.

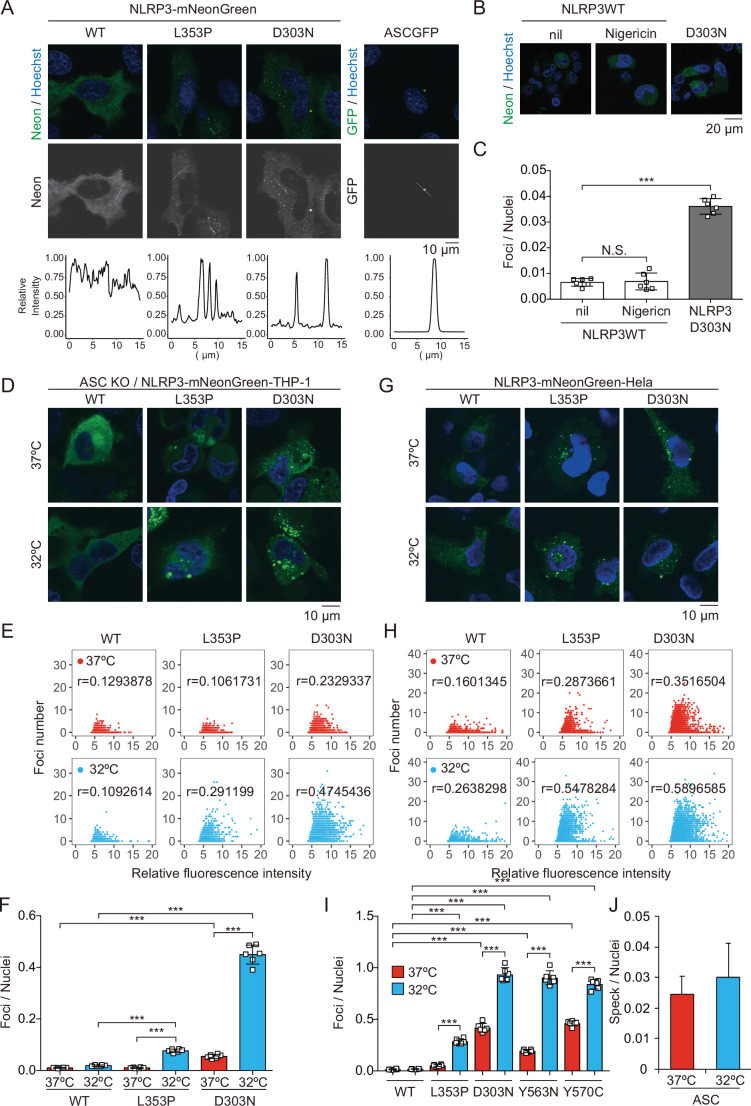
Figure 1—source data 1. Source data for Figure 1E.
Figure 1—source data 2. Source data for Figure 1H.
Figure 1—source data 3. Source data for Figure 1J.

Figure 1.

Figure 1—figure supplement 1. Expression of NLRP3-mNeonGreen and apoptosis-associated speck-like protein containing a caspase recruitment domain (ASC)-GFP.

Figure 1—figure supplement 1.

(A) Amino acid sequence of chronic infantile neurological, cutaneous, and articular syndrome (CINCA)-associated D303N mutant and familial cold autoinflammatory syndrome (FCAS)-associated L353P mutant. (B) Lysates of EF1-NLRP3-WT-, NLRP3-L353P-, NLRP3-D303N, NLRP3-Y563N, or NLRP3-Y570C-mNeonGreen-HeLa cells were analyzed by western blot. (C) EF1-NLRP3-WT-, NLRP3-Y563N-, or NLRP3-Y570C-mNeonGreen-HeLa cells were analyzed by confocal microscopy. (D–G) EF1-NLRP3-WT-, NLRP3-L353P-, NLRP3-D303N-, NLRP3-Y563N-, or NLRP3-Y570C-mNeonGreen-HeLa cells were cultured at 37 or 32°C for 24 hr. The number and area of the foci, and the fluorescence intensity of the cells were analyzed by high-content analysis. (D) The histogram of foci number in foci-positive cells. (E) The scatter plot of relative fluorescence intensity and foci number in each group. (F) Relative foci area per cell and (G) average foci area were quantified. (H) EF1-ASC-GFP-HeLa cells were cultured at 37 or 32°C for 24 hr. Representative image of confocal microscopy. (F and G) Data are expressed as the mean ± SD. ***p<0.005 as determined by two-way ANOVA with a post hoc test. Data are representative of two or three independent experiments. WT, wild type.
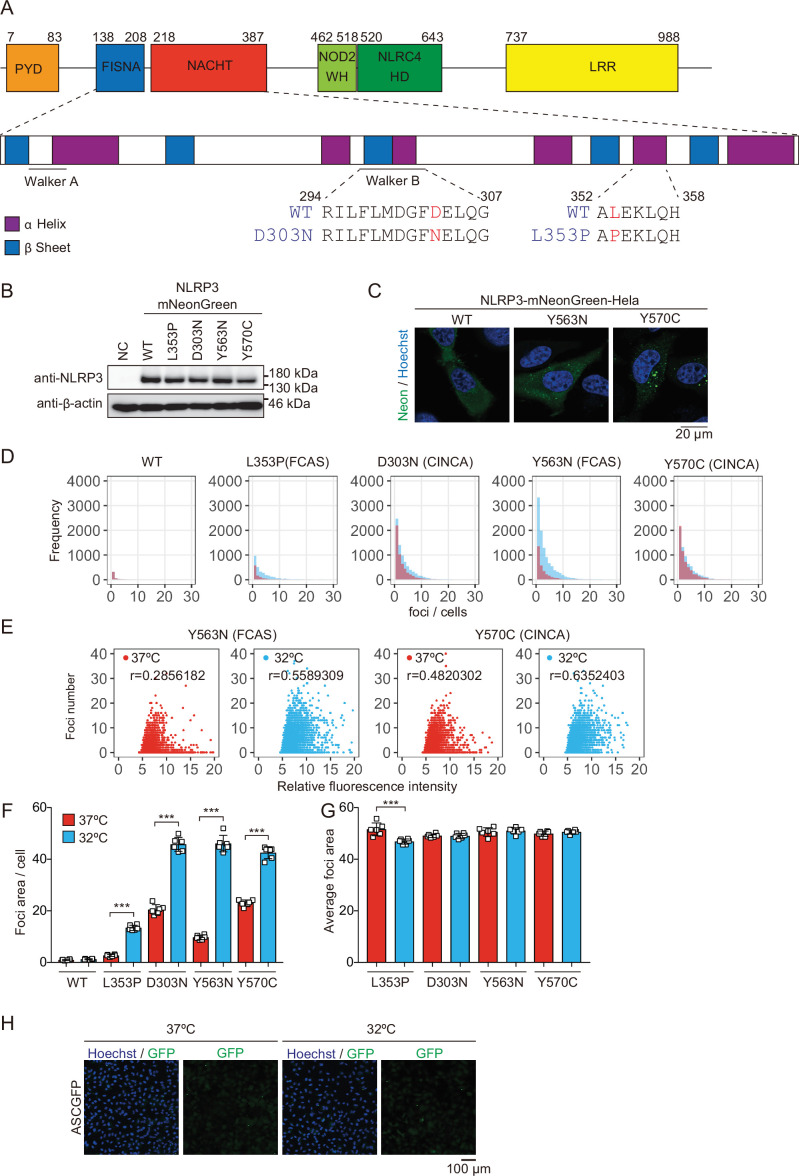
Figure 1—figure supplement 1—source data 1. Source data for Figure 1—figure supplement 1B.