. 2022 May 26;11:e75166. doi: 10.7554/eLife.75166

Figure 8. Pannexin 1 inhibition prevents familial cold autoinflammatory syndrome-associated NLRP3 mutant-mediated inflammasome assembly.

(A and B) Differentiated TRE-NLRP3-L353P-THP-1 cells were pretreated with 4 µM Fluo-8 for 1 hr and trovafloxacin (20 µM) for 30 min. After doxycycline (DOX) (30 ng/mL) treatment, the images were recorded at 5 min intervals from 3 hr to 6 hr. (A) The frequency of intracellular Ca2+ increase at each time point. (B) The cumulative number of Fluo-8-positive cells. (C–F) EF1-ASC-GFP/TRE-NLRP3-L353P-THP-1 cells were pretreated with (C and D) trovafloxacin (20 µM) or (E and F) probenecid (1 mM) for 30 min and then treated with DOX (30 ng/mL) at 37°C for 6 hr. Apoptosis-associated speck-like protein containing a caspase recruitment domain (ASC)-speck formation was analyzed by confocal microscopy. (C and E) Representative images by confocal microscopy. (D and F) The number of nuclei and specks was counted. (G – I) Differentiated TRE-NLRP3-L353P-THP-1 cells were pretreated with (G) trovafloxacin, (H) probenecid, or (I) MCC950 for 30 min and then treated with DOX (30 ng/mL) at 37 or 32°C for 6 hr. The IL-1β levels in the supernatants were assessed by ELISA (n=3). (J) EF1-ASC-GFP/TRE-NLRP3-L353P-THP-1 cells were pretreated with MCC950 and then treated with DOX (30 ng/mL) at 37°C. The formation of ASC speck was analyzed by high-content analysis. (G–J) Data are expressed as the mean ± SD. **p<0.01 and ***p<0.005 as determined by (G–J) two-way ANOVA with a post hoc test or (B, D, and F) Fisher’s exact test with the Holm correction. Data are representative of three independent experiments.

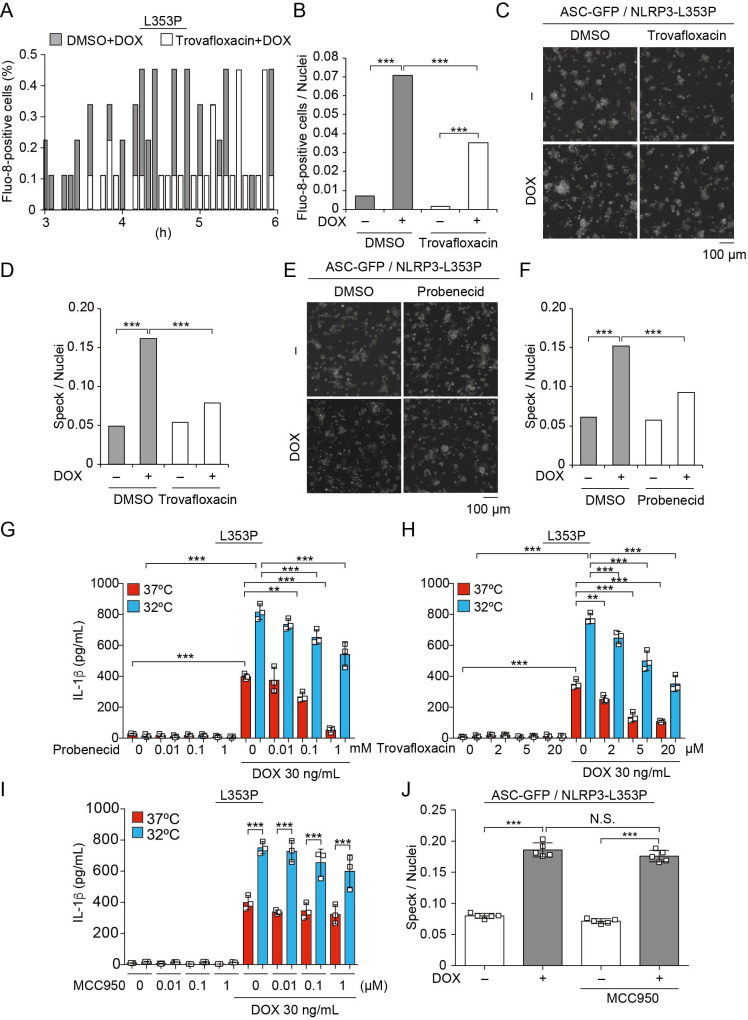
Figure 8—source data 1. Source data for Figure 8A and B.
Figure 8—source data 2. Source data for Figure 8D.
Figure 8—source data 3. Source data for Figure 8F.

Figure 8.

Figure 8—figure supplement 1. Pannexin 1 inhibition prevents familial cold autoinflammatory syndrome-associated NLRP3 mutant-mediated inflammasome assembly.

Figure 8—figure supplement 1.

(A and B) Differentiated TRE-NLRP3-L353P-THP-1 cells were pretreated with 4 µM Fluo-8 for 1 hr and then treated with doxycycline (DOX) (30 ng/mL) at 37°C for 6 hr. The images were recorded by confocal microscopy at 5 min intervals from 3 hr to 6 hr. (A) The frequency of intracellular Ca2+ increase at each time point. (B) The cumulative number of Fluo-8-positive cells. (C and D) Differentiated TRE-NLRP3-L353P-THP-1 cells were pretreated with 4 µM Fluo-8 for 1 hr and VX-765 (20 µM) for 30 min. After DOX (30 ng/mL) treatment, the images were recorded at 5 min intervals from 3 hr to 6 hr. (C) The frequency of intracellular Ca2+ increase at each time point. (D) The cumulative number of Fluo-8-positive cells. (E, F, H) Differentiated TRE-NLRP3-L353P-THP-1 cells were pretreated with (E) trovafloxacin, (F) probenecid, or (H) MCC950 for 30 min and then treated with nigericin (5 µM) at 37°C for 6 hr. The levels of IL-1β in the supernatants were assessed by ELISA (n=3). (G) Differentiated TRE-NLRP3-D303N-THP-1 cells were pretreated with probenecid for 30 min and then treated with DOX (30 ng/mL) at 37 or 32°C for 6 hr. The IL-1β levels in the supernatants were assessed by ELISA (n=3). (E–H) Data are expressed as the mean ± SD. ***p<0.005 as determined by two-way ANOVA with a post hoc test or (B, D) Fisher’s exact test with the Holm correction. Data are representative of three independent experiments.
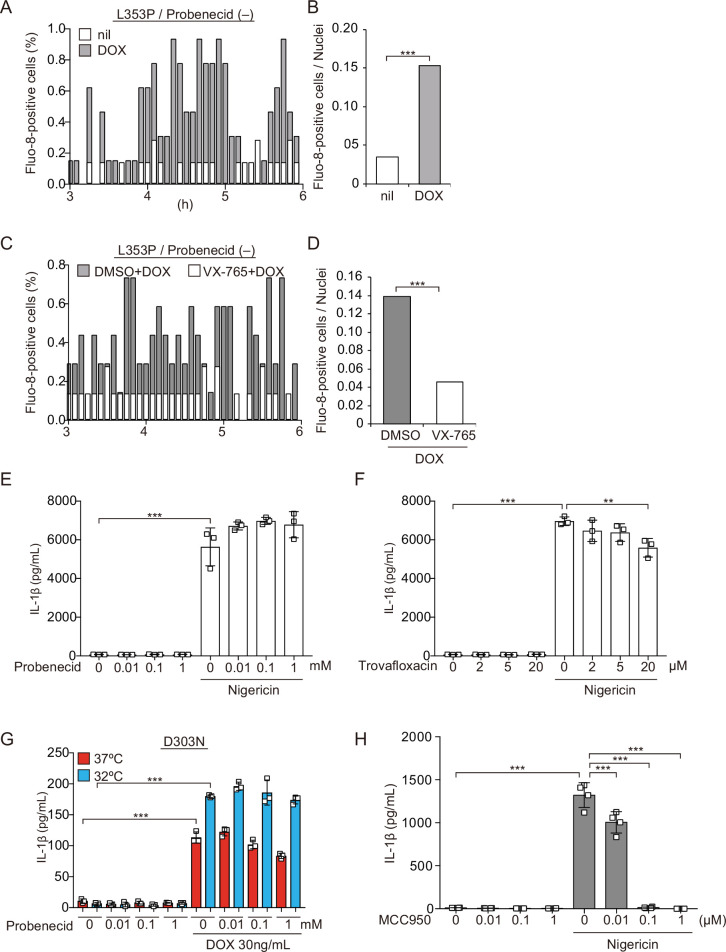
Figure 8—figure supplement 1—source data 1. Source data for Figure 8—figure supplement 1A.
Figure 8—figure supplement 1—source data 2. Source data for Figure 8—figure supplement 1C.