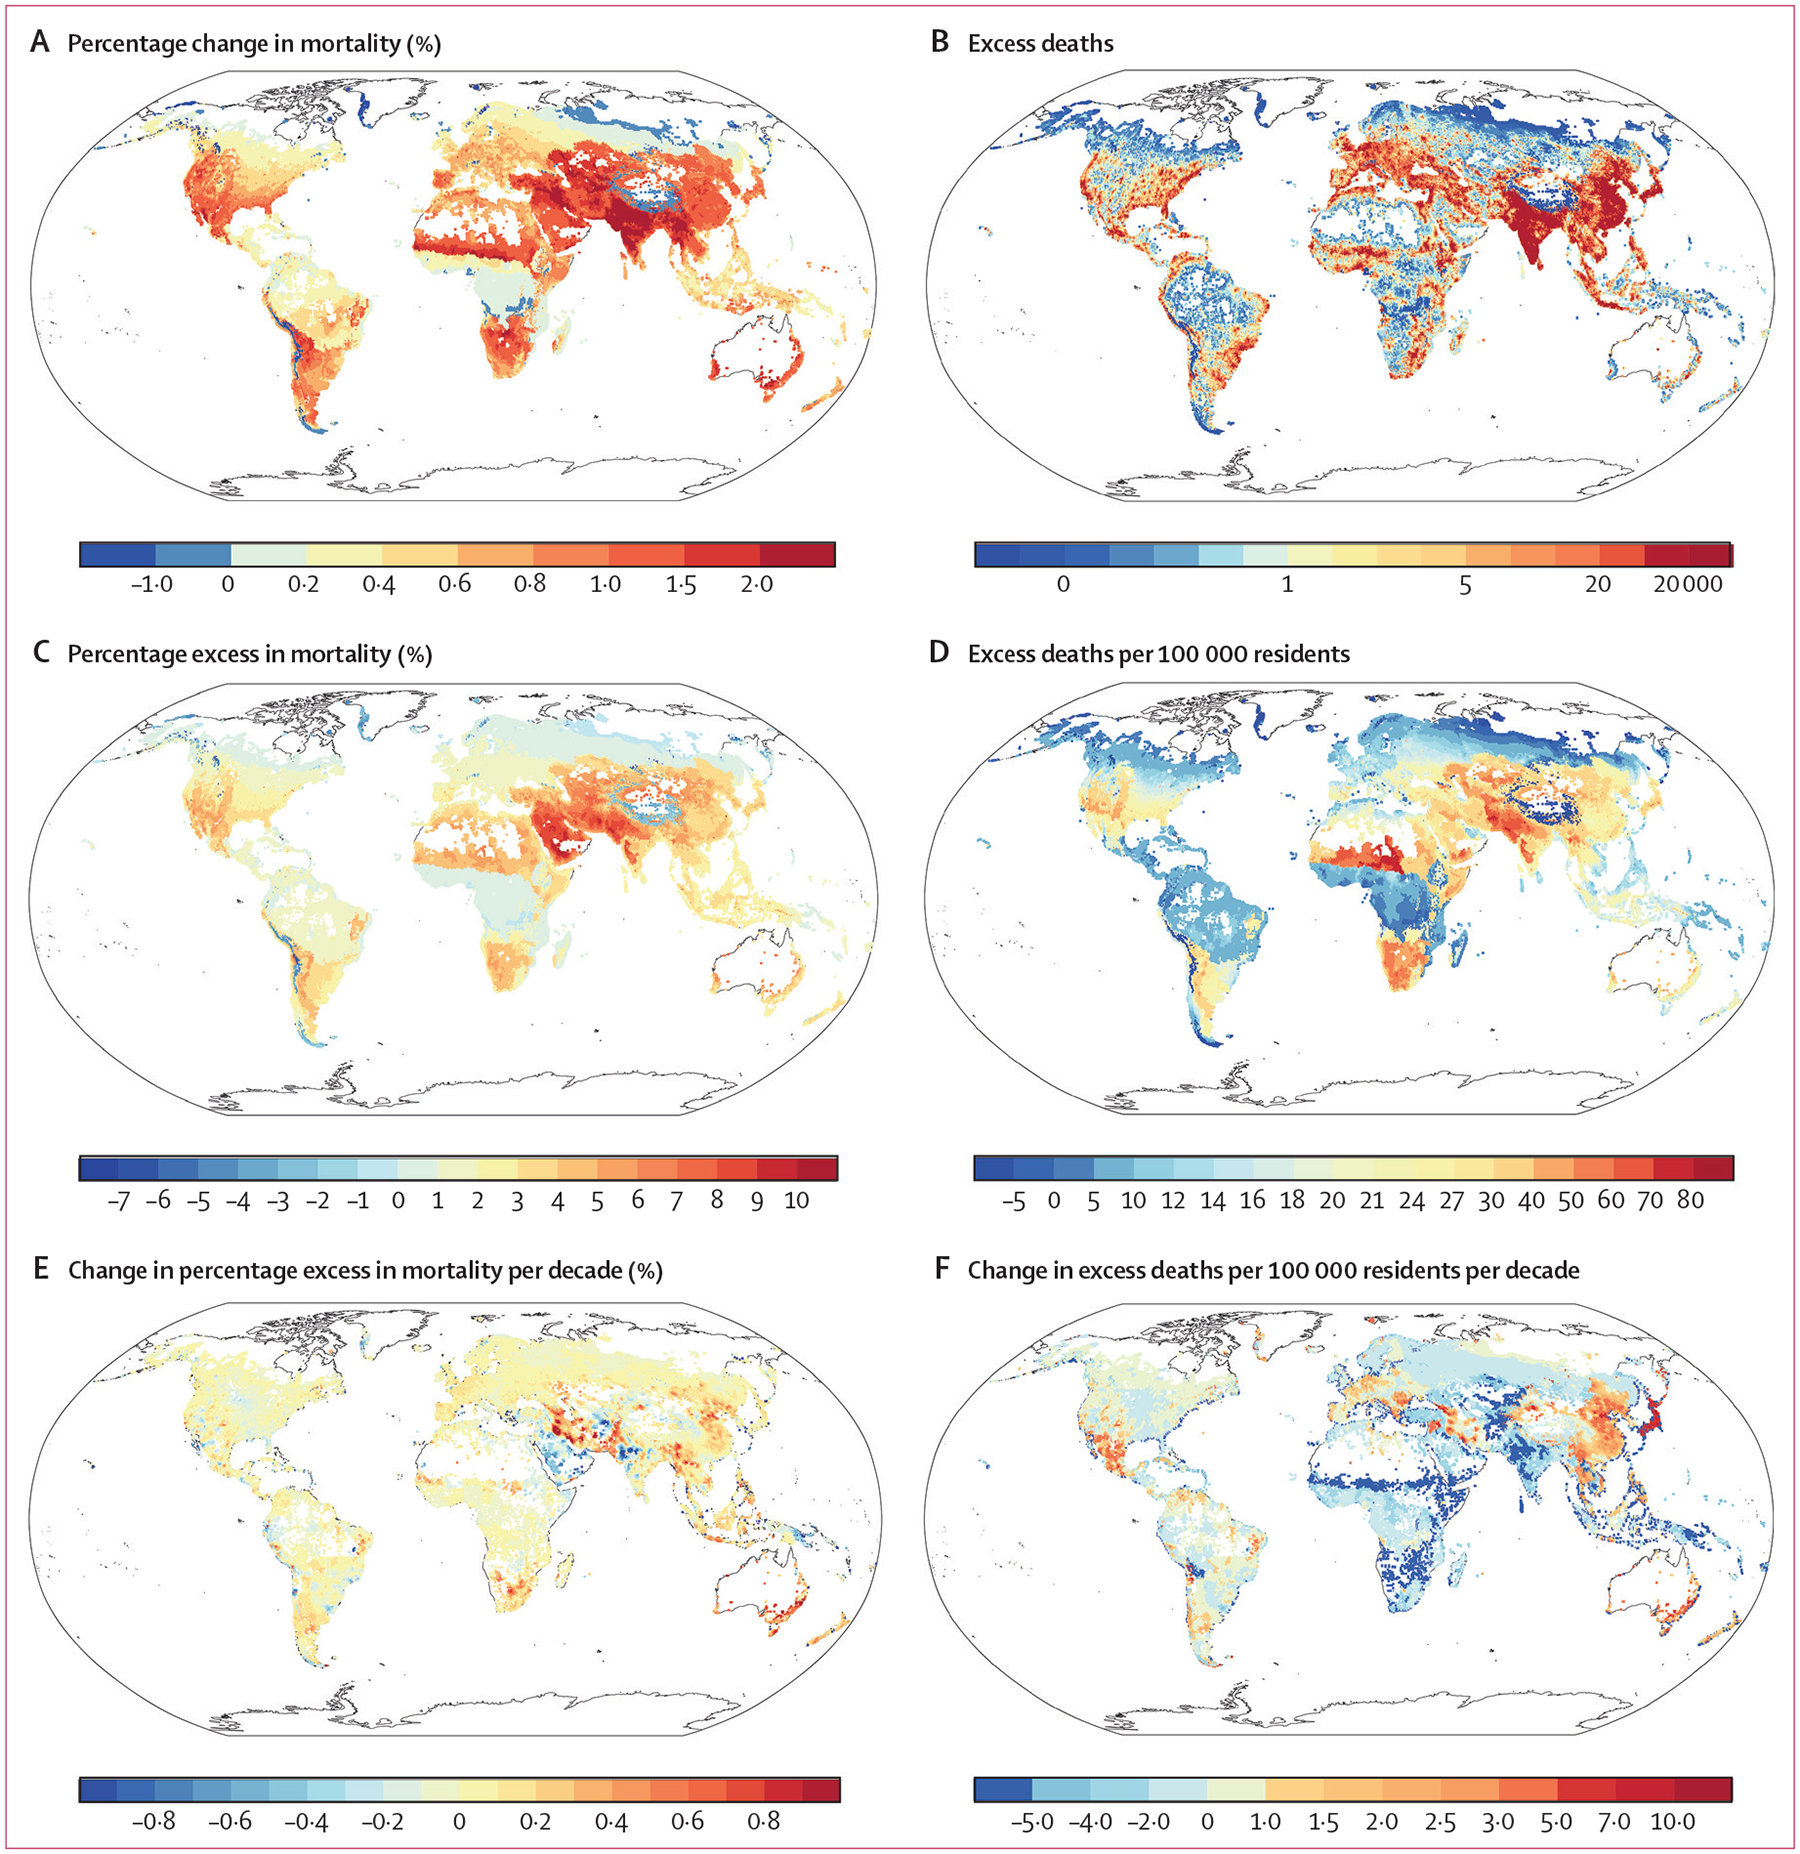
Figure 2: Percentage change in mortality associated with an IQR (for each grid cell) increase in temperature variability (A), mean annual excess deaths (B), percentage excess in mortality (C), excess deaths per 100 000 residents (D), change in percentage excess in mortality per decade (E), and change in excess deaths per 100 000 residents per decade (F) due to temperature variability in 2000–19 at a spatial resolution of 0·5° × 0·5°.

The scale in E represents change in percentage points, not percentage change.
