Figure 3.

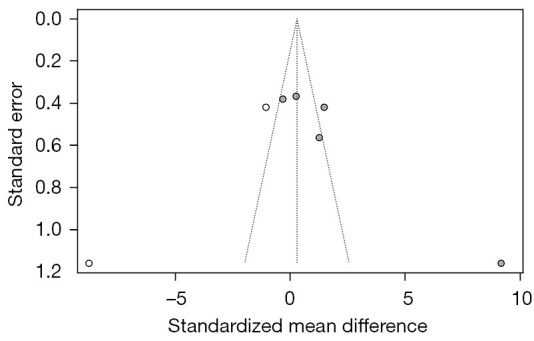
Funnel plot assessing risk of publication bias (plotting standardized mean difference in urine pH vs. the standard error of the mean difference).

Funnel plot assessing risk of publication bias (plotting standardized mean difference in urine pH vs. the standard error of the mean difference).