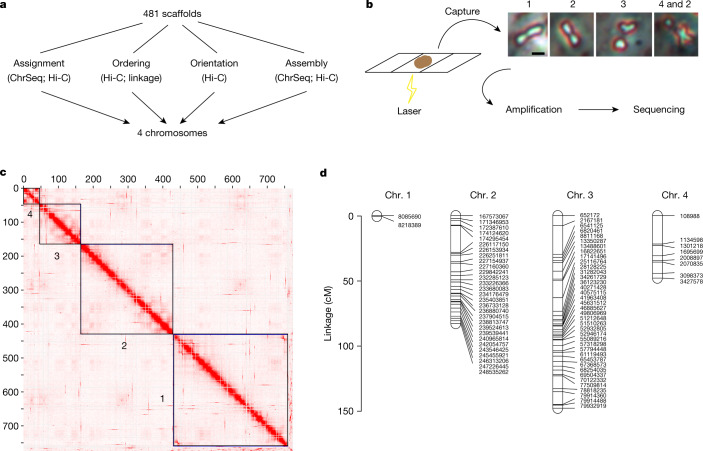
Fig. 1. Chromosome-scale genome assembly.
a, Schematic of the use of Hi-C, ChrSeq and a linkage map to transform 481 scaffolds26 into a chromosome-scale genome assembly. b, Chromosomes from mitotic cells spread onto membrane slides for laser capture and sequencing. Numbers denote the identity of chromosomes present in the representative samples. c, Contact heat map of chromatin interactions indicated by Juicebox4; black boxes denote the four chromosomes in the final assembly. d, Linkage map generated through LinkageMapView68, showing a lack of recombination on chromosome 1. Tick marks and labels indicate genetic markers.

