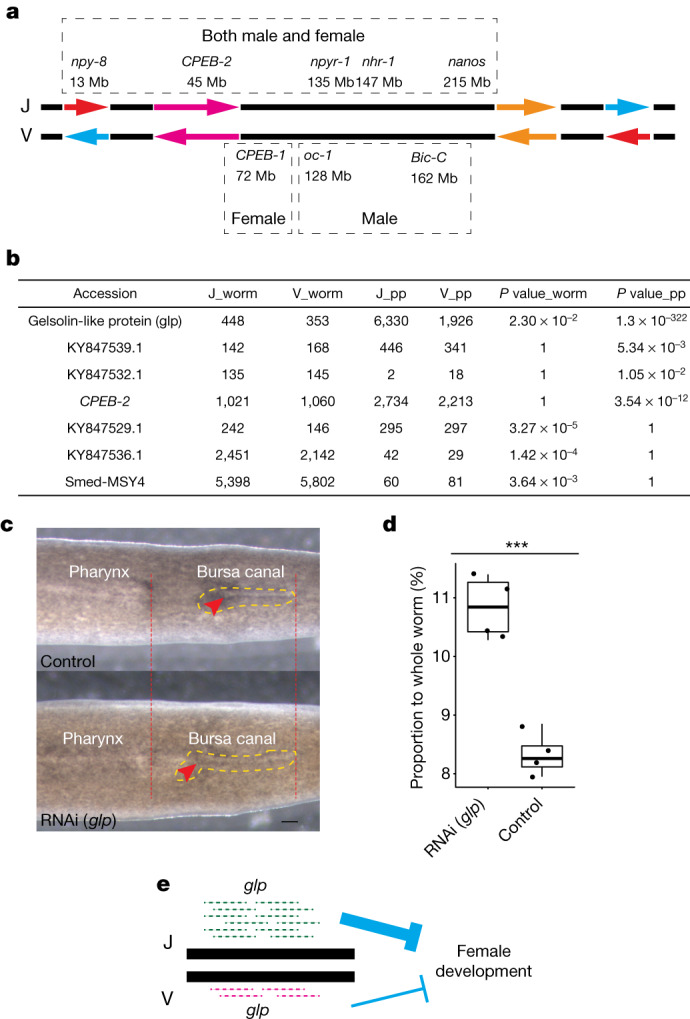
Fig. 4. Acquisition and haplotype-specific expression of sex-related genes.

a, Schematic diagram of the inferred structure of the J and V haplotypes on chromosome 1. Arrows denote putative inversions. Names, positions and sex specificity are shown for the eight genes on chromosome 1 with known key roles in the development of the reproductive system. b, Comparison of read counts for the J and V alleles of key genes in the transcriptomes of whole sexually mature worms and penis papillae (PP). Bonferroni-corrected P values from a two-sided binomial test of equal expression are shown. c, Dorsal view of control (top) and Smed-glp knockdown (bottom) sexually mature planarians. Red dashed lines and arrows indicate the posterior and anterior ends of the pharynx and the bursa canal, respectively. Scale bar, 400 um. Yellow dashed lines outline the bursa canal. d, Quantification of the length of the bursa canal relative to that of the whole worm. The y axis shows the percentage of whole-worm length spanned by the bursa canal as a box plot, with individual data points shown (n = 4 each for control and knockdown worms). Statistical significance was assessed with a two-sided, two-sample Student’s t-test (***P = 0.00029). RNAi (glp): minimum, 10.28; maximum, 11.4; median, 10.845; first quartile, 10.375; third quartile, 11.31. Control: minimum, 7.95; maximum, 8.85; median, 8.26; first quartile, 8.06; third quartile, 8.6. e, Model of negative regulation of bursa canal development by Smed-glp alleles.
