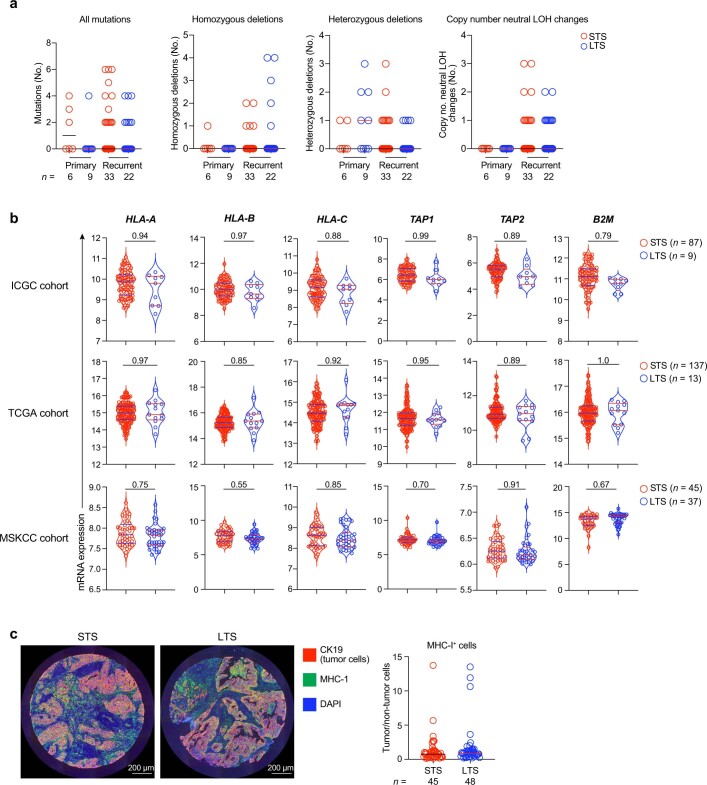
Extended Data Fig. 8. LTS and STS PDACs have equivalent genetic changes in HLA class-I pathway genes.
(a) Number of mutations (synonymous and non-synonymous), homozygous deletions, heterozygous deletions and copy number neutral loss of heterozygosity (LOH) changes in HLA class-I pathway genes (B2M, CANX, CALR, HLA-A, HLA-B, HLA-C, HLA-E, HLA-F, HLA-G, TAP1, TAP2, TAPBP, ERAP1, ERAP2, HSPA5, PDIA3, SAR1B, SEC13, SEC23A, SEC24A, SEC24B, SEC24C, SEC24D, SEC31A) in primary and recurrent PDACs. (b) mRNA expression in HLA class-I pathway genes by bulk RNA sequencing (ICGC, TCGA cohorts) and transcriptional analysis (Affymetrix, Memorial Sloan Kettering Cancer Center (MSKCC) cohort) in primary PDAC tumours. (c) Representative multiplexed immunohistochemical images (left) and ratio (right) of MHC-I+ tumour cells (CK19+) and MHC-I+ non-tumour cells (CK19-) in STS and LTS primary PDACs. n = individual tumours. Horizontal bars = median. Horizontal bars on violin plots show median and quartiles. P value by Wald’s test adjusted for multiple comparison testing.

