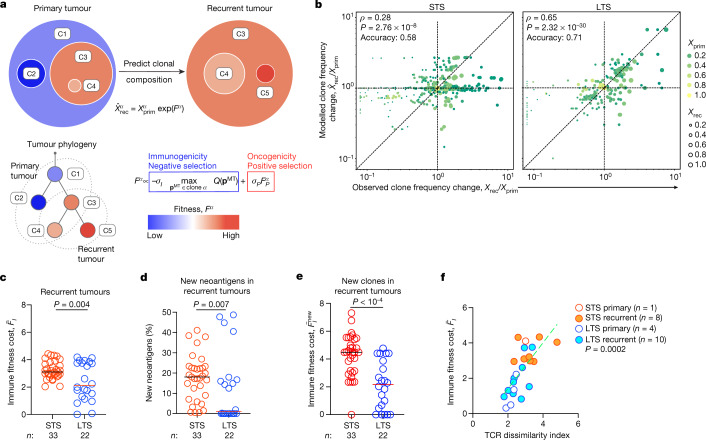
Fig. 4. The neoantigen quality fitness model identifies edited clones to predict the clonal composition of recurrent tumours.
a, Recurrent tumour clone composition prediction based on the primary tumour composition and the fitness model. b, Model fitted and observed clone frequency changes for the STS (left) and LTS (right) cohorts. Frequency ratios below the sampling threshold were evaluated with pseudocounts. c–e, The immune fitness cost of recurrent tumours (c), new clones (e), and the percentage of new neoantigens in recurrent tumours (d). f, TCR dissimilarity index and immune fitness cost in tumours. n indicates the number of tumours. The green line is a linear regression fit. The horizontal bars show the median values. P values were determined using two-tailed Spearman correlation (b), two-tailed Pearson correlation (f) and two-tailed Mann–Whitney U-tests (c–e).

