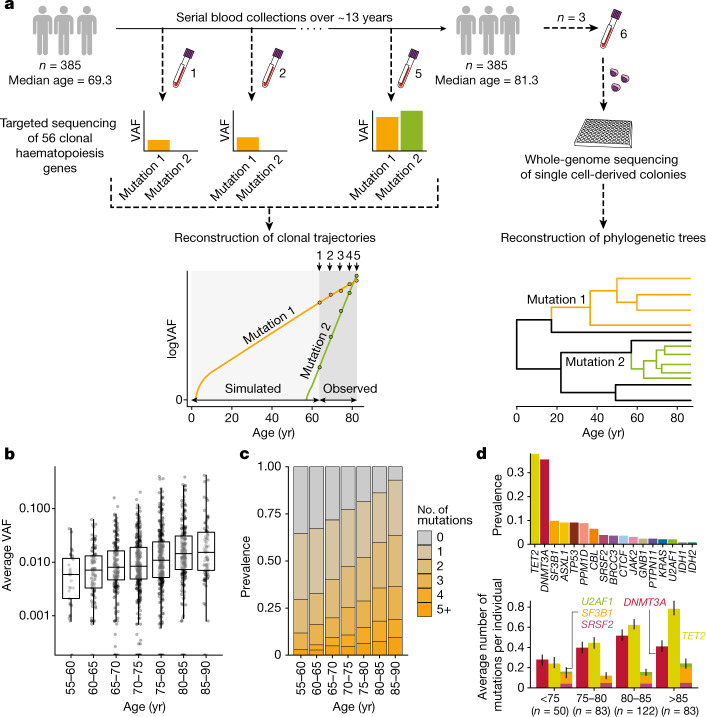
Fig. 1. Experimental workflow and clonal haematopoiesis mutation characteristics.
a, Study outline: 1,593 blood DNA samples were obtained from 385 elderly individuals sampled 2–5 times (median 4) over 3.2–16 years (median 12.9) and sequenced for mutations in 56 clonal haematopoiesis genes. Measured VAFs were used to fit observed clonal trajectories and extrapolate the clonal dynamics prior to the period of observation. Additional blood samples from 3 selected individuals were used to generate 288 (that is, 3 × 96) whole-genome-sequenced single cell-derived colonies for phylogeny reconstructions. b, Age distribution of average VAF per individual (n = 1,258 VAF measurements). The boxes represent the 25th, 50th (median) and 75th percentiles of the data; the whiskers represent the lowest (or highest) datum within 1 interquartile range from the 25th (or 75th) percentile. c, Age-stratified prevalence of the number of mutations per individual. d, Prevalence of mutations in driver genes. Top, absolute prevalence in the cohort. Bottom, average number of mutations per individual in DNMT3A, TET2 and splicing genes (SF3B1, SRSF2 and U2AF1) at different ages, with error bars representing bootstrap 90% confidence intervals.

