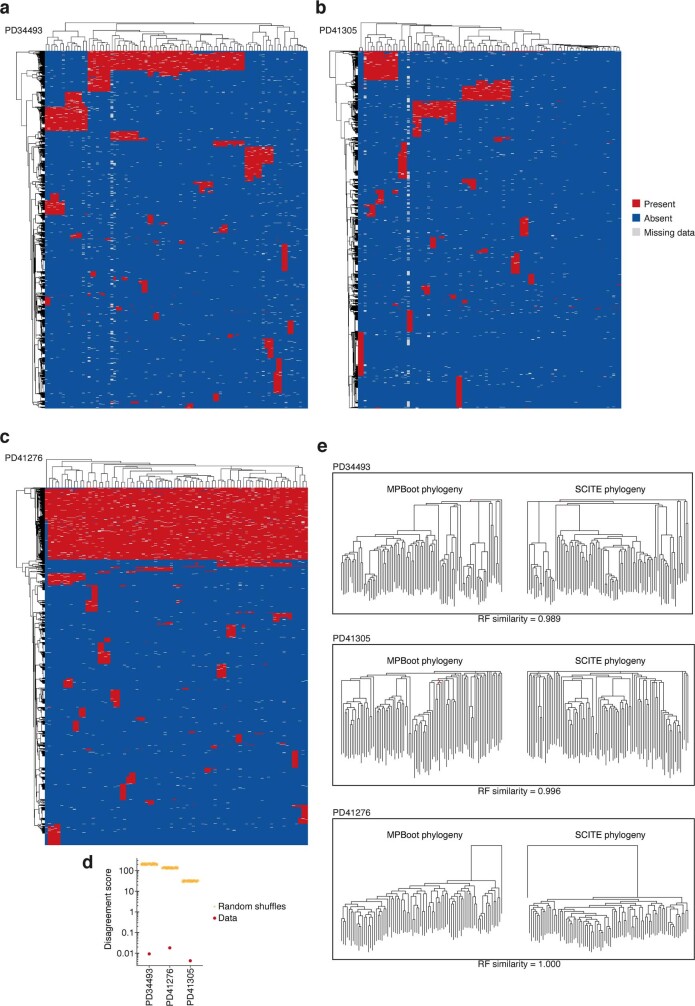
Extended Data Fig. 5. Data quality and validation of phylogenetic trees.
a–c, Heatmaps of the genotype data used for tree inference for the three individuals for which trees were derived in our study (PD34493, PD41305 and PD41276, respectively), with colours corresponding to the presence (red), absence (blue) and uncertainty (grey) of each genotype (rows) across all colonies (columns). For both colonies and genotypes, dendrograms derived from the hierarchical clustering of each are shown and are not representative of the derived phylogenetic trees. d, Internal consistency of the shared mutation data for each individual as determined by the disagreement score. A perfect phylogeny has a score of zero. We compare scores for the data with scores for random shuffles of the genotype data at each locus. e, Comparison of phylogenetic trees built by alternative phylogeny-inference algorithms, MPBoot and SCITE, for each of the 3 individuals. For all three we present the Robinson-Fould (RF) similarity between trees built by the two methods, with 0 representing completely different trees and 1 representing identical trees. Branching events that are different between trees constructed using the two methods are highlighted in red.

