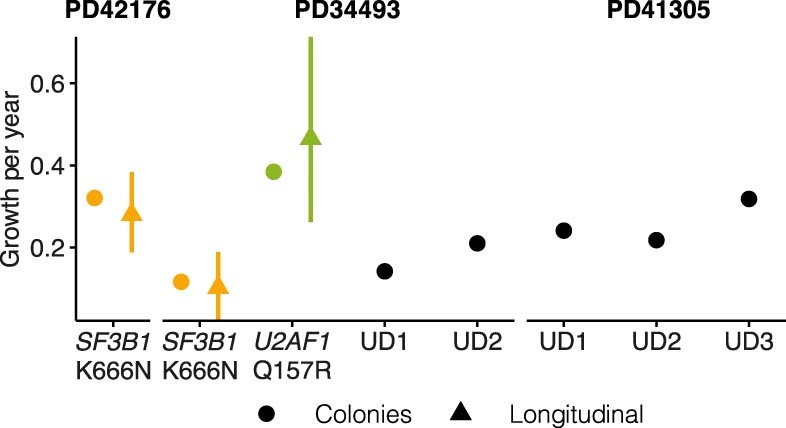
Extended Data Fig. 6. Lifelong growth in phylogenetic trees.

Comparison between annual growth derived from phylogenies and growth observed in longitudinal data. For the phylogenies this was obtained by fitting an exponential growth curve to the entire phylodynamic trajectory. For growth rates derived from longitudinal data, error bars represent the 90% HPDI; for growth rates derived from phylogenies (colonies), error bars represent +/− the standard error.
