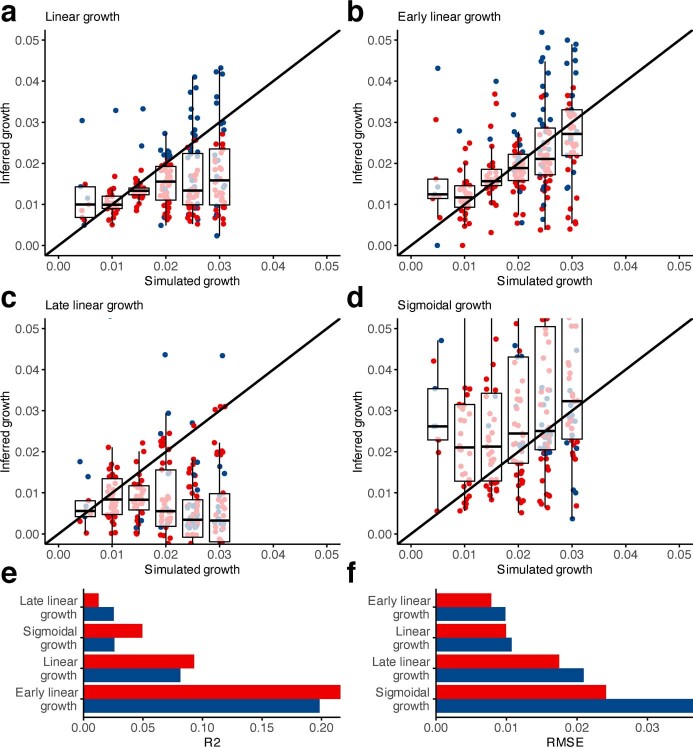
Extended Data Fig. 8. Estimation of the true clone fitness from phylodynamic estimation.
Three fits were tested to estimate the true clone fitness from phylodynamic estimation of the population size and these estimates were plotted as a function of the true fitness size (0.005, 0.010, 0.015, 0.020, 0.025 or 0.030). a, A log-linear fit; b–c, A biphasic fit that estimates an early and a late growth rate and a change-point between both and d, a sigmoidal fit (n = 241 simulated trajectories). e, Coefficient of correlation (R2) for all four inferred coefficients. f, Root mean squared error (RMSE) for all four inferred coefficients. In this figure red represents “low variance trajectories” (the average estimated variance for the logarithm of the trajectory is under 5) and blue represents “all trajectories”. The boxes in a-d represent the 25th, 50th (median) and 75th percentiles of the data; the whiskers represent the lowest (or highest) datum within 1 interquartile range from the 25th (or 75th) percentile.

