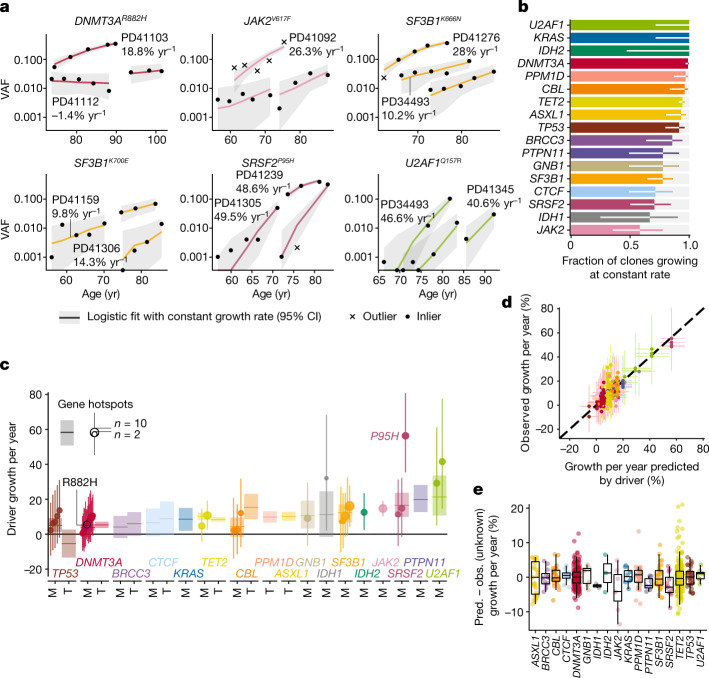
Fig. 2. The longitudinal dynamics of clonal haematopoiesis in older age.
a, Examples of fitted exponential growth of clones with mutations at six common hotspots. Points represent observed data, coloured lines represent estimated VAF trajectories and grey bands represent the 90% highest posterior density interval (HPDI). Each data point is represented by a dot if it conforms to our model of fixed-rate exponential growth and by a cross otherwise (outlier, defined as tail probability <2.5%). b, Proportion of clonal trajectories showing fixed-rate growth—that is, those with no outlying data-points as defined in a. Bars represent the proportion and error bars represent the 90% beta-distributed confidence interval. c, Annual clonal growth associated with different driver mutations, for both genes and specific sites. For gene-wise growth, truncating (T) and missense (M) mutations are modelled separately for genes where both are enriched. Sites are modelled separately to genes if mutated recurrently within our cohort. Point estimates for growth and 90% HPDI are represented for each site (dot and line, respectively, with dot size proportional to recurrence) and each gene (horizontal line and rectangle, respectively). d, Relationship between clonal growth predicted by the identity of the driver mutation and actual observed growth (points), with 90% HPDI represented by vertical and horizontal lines, respectively. n = 633 clones. e, Distribution of the unknown-cause effect for different genes. Each point represents a single clone and box plots represent the distribution of these effects for each gene. The value of unknown-cause growth is positive for clones growing faster than expected by the identity of the driver mutation, and negative for clones growing slower than expected (n = 633 clones). The boxes represent the 25th, 50th (median) and 75th percentiles of the data; the whiskers represent the lowest (or highest) datum within 1 interquartile range from the 25th (or 75th) percentile. Pred., predicted; obs., observed. CI, confidence interval.

