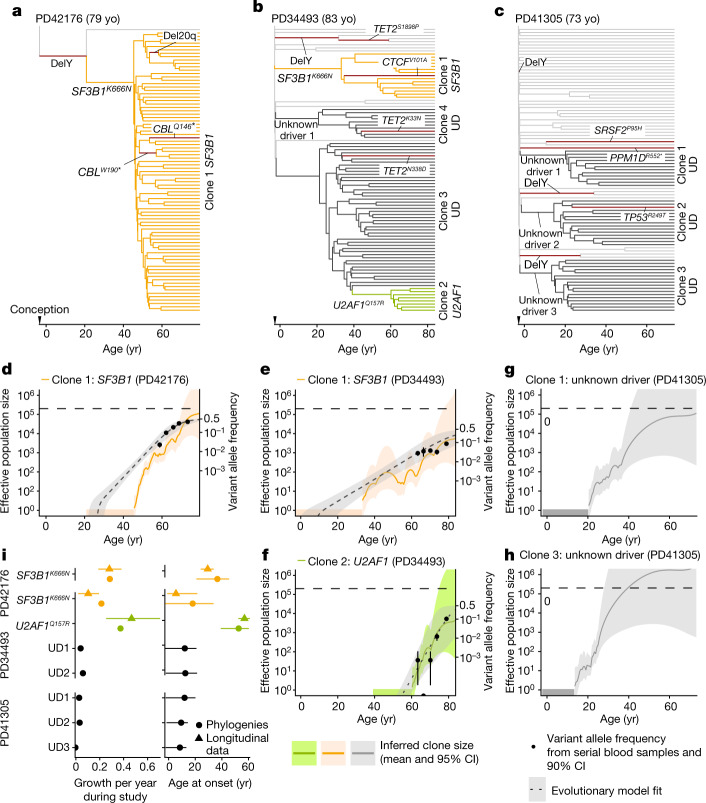
Fig. 3. Haematopoietic phylogenetic trees.
a–c, Haematopoietic phylogenies of participants PD41276 (a), PD34493 (b) and PD41305 (c). Each tree tip is a single cell-derived colony and tips with shared mutations coalesce to an ancestral branch, from which all colonies in such a ‘clade’ arose. Branch lengths are proportional to the number of somatic mutations, which accumulate linearly with age except before birth, at which point approximately 55 mutations have been acquired36. Branches containing known driver mutations or chromosomal aberrations are annotated. Clonal expansions are coloured: SF3B1K666N-mutant expansions in orange, U2AF1Q157R-mutant expansions in green, and expansions without identified drivers (unknown driver (UD)) in black. d–h, Growth trajectories of each clonal expansion, as determined by phylogenies (effective population size (Neff) estimated using phylodynamic methods) and time-series data (using serial VAF measurements and modelled historical growth, as illustrated in Fig. 2, if available). SF3B1-mutant expansions for PD42176 (d) and PD34493 (e), U2AF1-mutant expansions for PD34493 (f), and unknown driver expansions clone 1 (g) and clone 3 (h) for PD41305. Phylogeny-derived age at clone onset range is represented as a horizontal coloured bar on the x-axis, with the limits of the bar corresponding to the age range of the phylogeny branch along which the corresponding driver mutation was acquired. i, Comparison of the ages at onset (right) and growth rate during the study period (left) derived from phylogenetic trees and longitudinal data. For the age at onset and growth rates derived from longitudinal data, the intervals represent the 90% HPDI; age at onset intervals derived from phylogenies represent the age limits defined by phylogenetic branching patterns. For annual growth estimates using phylogenies, intervals represent the standard error. yo, years old.

