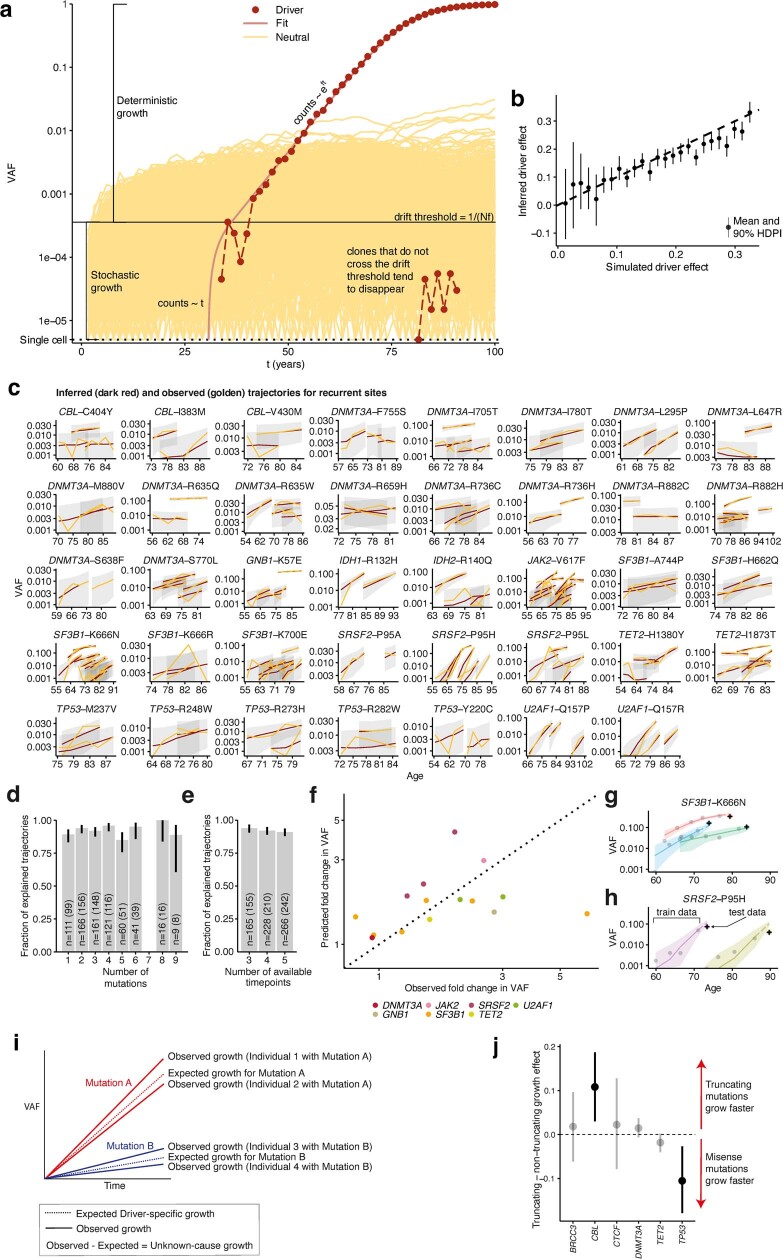
Extended Data Fig. 3. Modelling CH dynamics in older age using time-series VAF data (previous page).
a, Representation of a Wright-Fisher simulation, showing two phases of clonal growth. The likelihood of a clone transitioning from stochastic to deterministic growth is inversely proportional to the product of its fitness (f) and the total number of stem cells (N). Clones with no fitness advantage (depicted in yellow) are unlikely to exceed their drift thresholds and tend to disappear or remain undetectable. Fitter clones (depicted in red) are more likely to reach deterministic growth. b, Association between the driver mutation effect used in the Wright-Fisher simulations and the driver effect inferred using our model (R2 = 0.92; n = 270 simulated clones). Error bars represent 90% highest posterior density interval (HDPI). c, Comparison of observed (golden) and inferred (mean estimate; red) trajectories for all recurrently mutated sites. Grey bands represent 95% highest posterior density intervals. d, Relationship between the number of mutations co-occurring within an individual and the proportion of clones growing at a fixed rate over time (n = 685 clones; the number of clones used to calculate each ratio estimate is represented on each bar and in brackets is the number of explained trajectories). e, Relationship between the number of available timepoints in a trajectory and the proportion of clones growing at a fixed rate over time (n = 659 clones; the number of clones used to calculate each ratio estimate is represented on each bar and in brackets is the number of explained trajectories). Error bars represent the beta-distributed 90% confidence intervals (in d and e). f, Association between predicted and observed VAF in additional prospectively-collected samples from 11 individuals with 15 CH driver mutations, not used for growth rate inference. The dotted line depicts theoretical perfect agreement between predicted and observed VAF. g,h, Example trajectories of clones with SF3B1-K666N (f) and SRSF2-P95H (g) mutations. Points represent VAFs used in our model to fit the growth curve (train), and crosses represent prospectively tested VAFs used (test), showing good agreement between predicted and observed VAFs. Bands represent the 95% HPDI. i, Illustration of the determinants of growth in our model. Each mutation drives an expected rate of clonal growth. j, Comparison of growth rate associated with truncating vs non-truncating mutations in genes with both driver types. Points above the dashed line show faster growth for truncating mutations, and points below show faster growth for non-truncating mutations (n = 514 clones). Intervals represent the 90% HPDI for the difference between truncating and non-truncating mutations.

