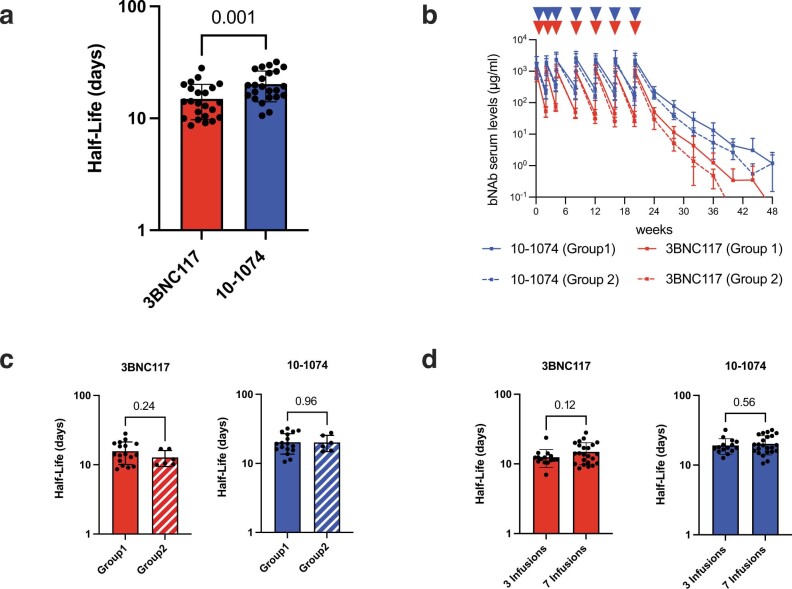
Extended Data Fig. 3. Pharmacokinetics of 3BNC117 and 10-1074.
a, Scatter bar plots show half-lives of 3BNC117 (red) and 10–1074 (blue). Each dot represents a single participant (n = 23). Bars show mean values and standard deviation. Statistical significance was determined using a two-tailed paired t-test. b, 3BNC117 (red) and 10–1074 (blue) levels in serum for Group 1 (n = 17) and Group 2 (n = 6) participants. Curves indicate mean serum antibody concentrations and error bars represent standard deviation. c, Scatter bar plots show half-lives of 3BNC117 (red) and 10–1074 (blue) separated for Group 1 (n = 17) and Group 2 (n = 6) participants. Each dot represents a single participant. Bars show mean values and standard deviation. Statistical significance was determined using a two-tailed unpaired t-test. d, 3BNC117 (red) and 10-1074 (blue) half-live comparison between individuals receiving up to 3 infusions of the combination of 3BNC117 + 10–107412 (n = 15) and participants receiving up to 7 infusions of the combination of 3BNC117 + 10–1074 (n = 23). Each dot represents a single participant. Bars show mean values and standard deviation. Statistical significance was determined using a two-tailed unpaired t-test.

