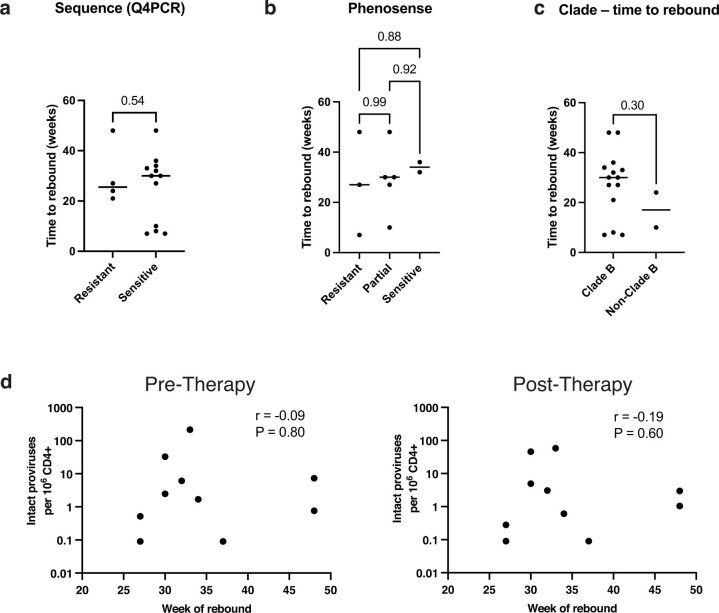
Extended Data Fig. 4. Time to viral rebound.
a, Comparison of time to viral rebound between Group 1 participants with genotypically 10-1074 resistant or sensitive reservoir viruses recovered by Q4PCR. Black line depicts median. Statistical significance was determined using a two-tailed unpaired t-test. b, Comparison of time to viral rebound between Group 1 participants with phenotypically resistant (n = 3), partially resistant (n = 5) or sensitive (n = 2) reservoir viruses to 3BNC117 and 10–1074 by PhenoSense. Black line depicts median. Statistical significance was determined using one-way ANOVA with Tukey multiple comparison test. c, Comparison of time to viral rebound between Group 1 that harbor clade B (n = 15) and non-clade B viruses (n = 2), respectively. Black line depicts median. Statistical significance was determined using a two-tailed unpaired t-test. d, Intact proviral frequency per 106 CD4 T cells versus time of viral rebound in the Group 1 participants that remained suppressed after week 20 (n = 10). Graphs show the correlation at pre- (left) and post-therapy (right) time points, respectively. The r and P values were determined by two-tailed Pearson’s correlations.

