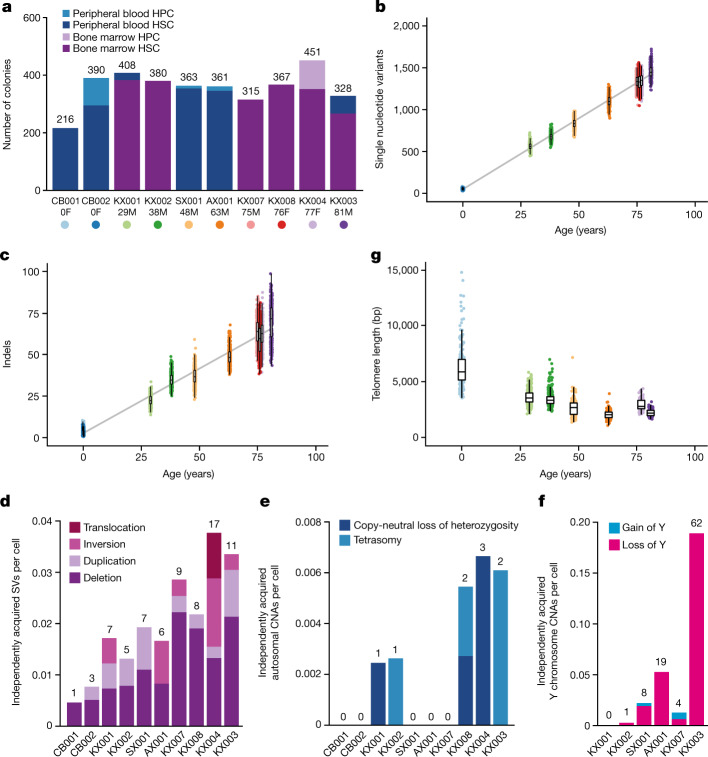
Fig. 1. Mutational burden in normal HSC/MPPs.
a, Bar plot showing the numbers of colonies sequenced from each tissue and cell type for each donor in the study. Age and sex (F, female; M, male) are indicated below the donor ID. b, Burden of single nucleotide variants across the donor cohort. The points represent individual HSC/MPP colonies (n = 3,361) and are coloured by donor as indicated in a. The grey line represents a regression of age with mutation burden, with shading indicating the 95% confidence interval. c, Burden of small indels across the donor cohort. d, Bar plot showing the number of independently acquired structural variants (SVs) per colony sequenced in each donor. The absolute number of structural variants is shown at the top of each bar. e, Bar plot showing the number of independently acquired autosomal copy number aberrations (CNAs) per colony sequenced in each donor. The absolute number of copy number aberrations is shown at the top of each bar. f, Bar plot showing the number of independently acquired Y chromosome copy number aberrations sequenced in each male donor. The absolute number of copy number aberrations is shown at the top of each bar. g, Telomere length across the donor cohort, including only those samples sequenced on the HiSeq X10 platform. Each point represents a single HSC/MPP colony. Two outlying points for CB001 are not shown (telomere lengths 16,037 bp and 21,155 bp). In b, c, g, boxes overlaid indicate the median and interquartile range and whiskers denote the minimum of either the range or 25th and 75th centile plus 1.5× interquartile range.

