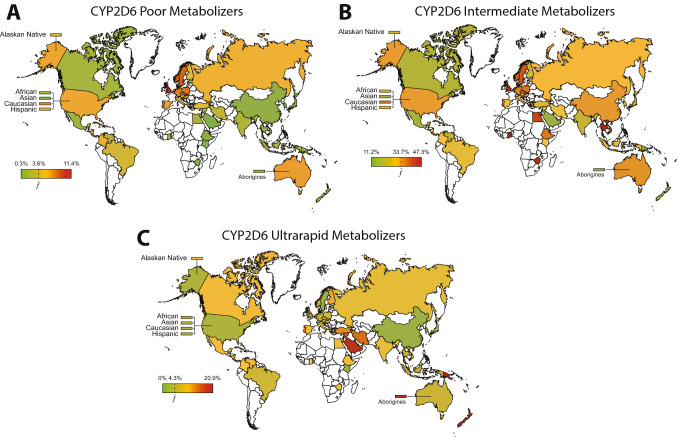
Fig. 1.
Global distribution of inferred CYP2D6 phenotypes. Frequencies of CYP2D6 poor metabolizer (A), intermediate metabolizer (B) and ultrarapid metabolizer (C) phenotypes were calculated based on the frequencies of loss-of-function alleles (*3, *4, *5 and *6), decreased function alleles (*9, *10, *17, *29 and *41) and increased function alleles (*1xN and *2xN) from 53 countries/populations (Tables 1 and 2; Supplementary Table 1). Countries are color-coded with the highest frequency in red, the average frequency across all populations () in yellow, and the lowest frequency in green. In case of missing population frequencies, averaged continent frequency data from the literature (Gaedigk et al. 2017) were used to infer metabolizer phenotypes

