FIGURE 2.

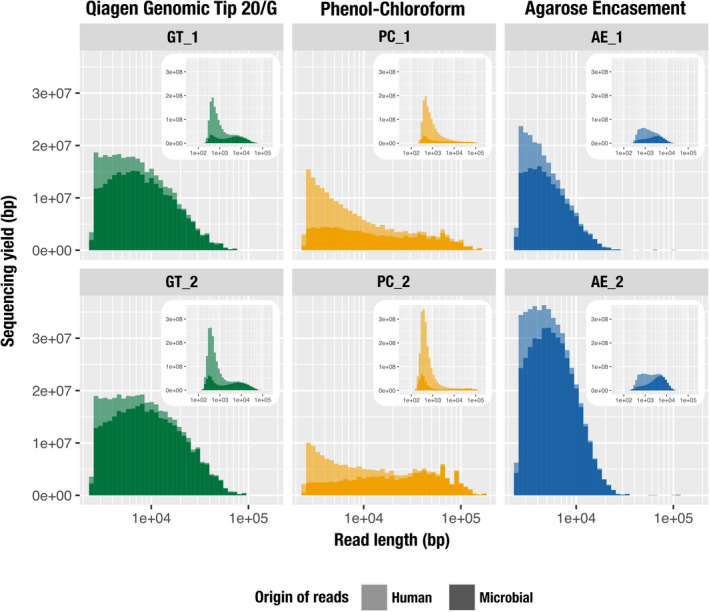
The impact of DNA extraction protocol on the distribution of human (lighter colour) and microbial (darker colour) read lengths from MinION sequencing. These histograms visualize the total accumulative length (total number of nucleotides sequenced) per range of individual read lengths. The x‐axis represents the read length on a log scale and the y‐axis represents the cumulative length for a given size bin (bar width). The main panel shows the size distribution of reads >2500 bp for GT (green), PC (yellow) and AE (blue) while the inset panel shows the size distribution of all reads, using the same data. Results are outlined vertically by extraction method (replicate 1, top panel; replicate 2, lower panel)
