
FIGURE 2.
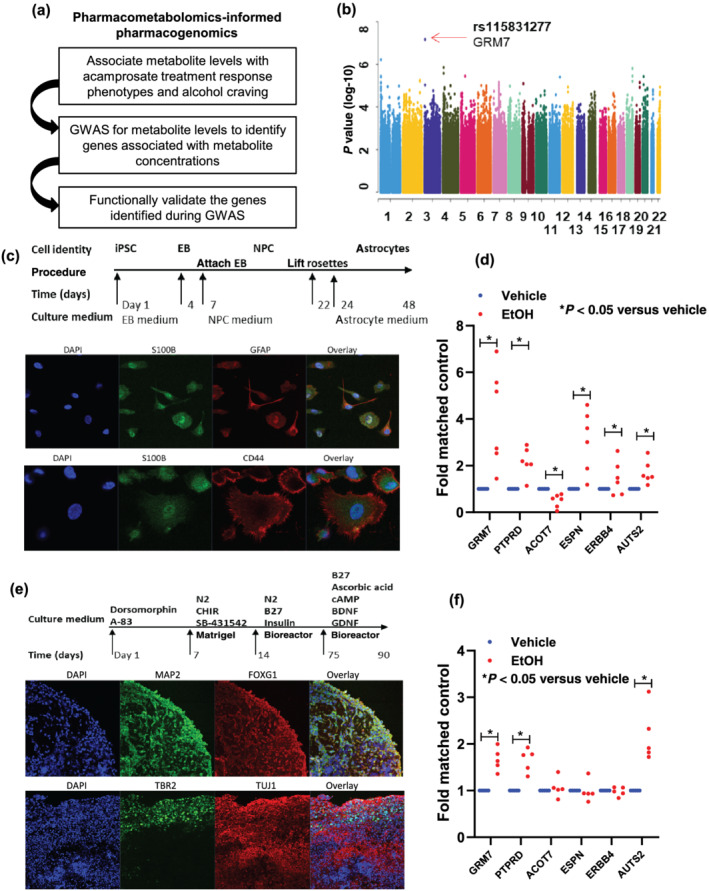
(a) Schematic outline of pharmacometabolomics‐informed pharmacogenomics research strategy. (b) Manhattan plot for GWAS of plasma concentrations of ethanolamine that were associated with acamprosate treatment outcomes. (c) A schematic outline of procedures used during the differentiation of iPSC‐derived forebrain astrocytes. The panel below the schematic displays representative examples of staining for astrocyte markers (S100β and GFAP). iPSC indicates induced pluripotent stem cell. EB indicates embryonic body. NPC indicates neural progenitor cell. (d) Effect of ethanol (EtOH: 25 mM) on mRNA expression in iPSC‐derived forebrain astrocytes for SNP loci identified during the ethanolamine GWAS with P value < 10−6. Real‐time PCR was performed using iPSC‐derived forebrain astrocytes from six AUD subjects. *P < 0.05, significantly different as indicated; Mann–Whitney U test. (e) A schematic outline of procedures used during the differentiation of iPSC‐derived forebrain organoids. The panel below the schematic displays representative examples of staining for neuronal markers (MAP 2 [Sigma‐Aldrich Cat# M2320, RRID:AB_609904], FOXG1 [Abcam Cat# ab18259, RRID:AB_732415] and TUJ1 [Covance Cat# MMS‐435P, RRID:AB_2313773]) and for a cortical layer marker (TBR2 [Abcam Cat# ab75720, RRID:AB_1310743]). (f) Effects of ethanol (EtOH: 25 mM) on gene expression in iPSC‐derived forebrain organoids for SNP loci identified during the ethanolamine GWAS with P value < 10−6. Real‐time PCR was performed using iPSC‐derived forebrain organoids (n = 5). Thedot plot displays mRNA expression levels (EtOH treatment vs. vehicle treatment). Real‐time PCR results were analysed using 2−ΔΔct method. As a result, the control mean is 1, and there is no variance in the control. Real‐time PCR data were then analysed using non‐parametric statistical tests (Mann–Whitney U test). *P < 0.05, significantly different as indicated