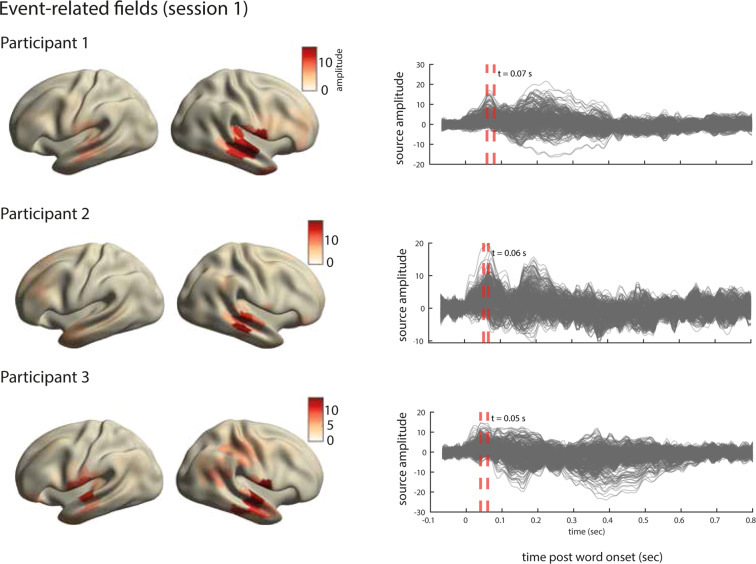
Fig. 8.
Analysis of evoked responses for one session in the dataset. Right. Line plots show the averaged source time courses (ERFs) for all brain parcels (each line represents a brain parcel). Time point 0 on the time axis indicates the word onset. Left. The source topographies show the distribution of activations designated by the orange dashed line in the ERF time courses on the right. We selected the time points that approximately correspond to the peak activation of the earliest component post word-onset.

