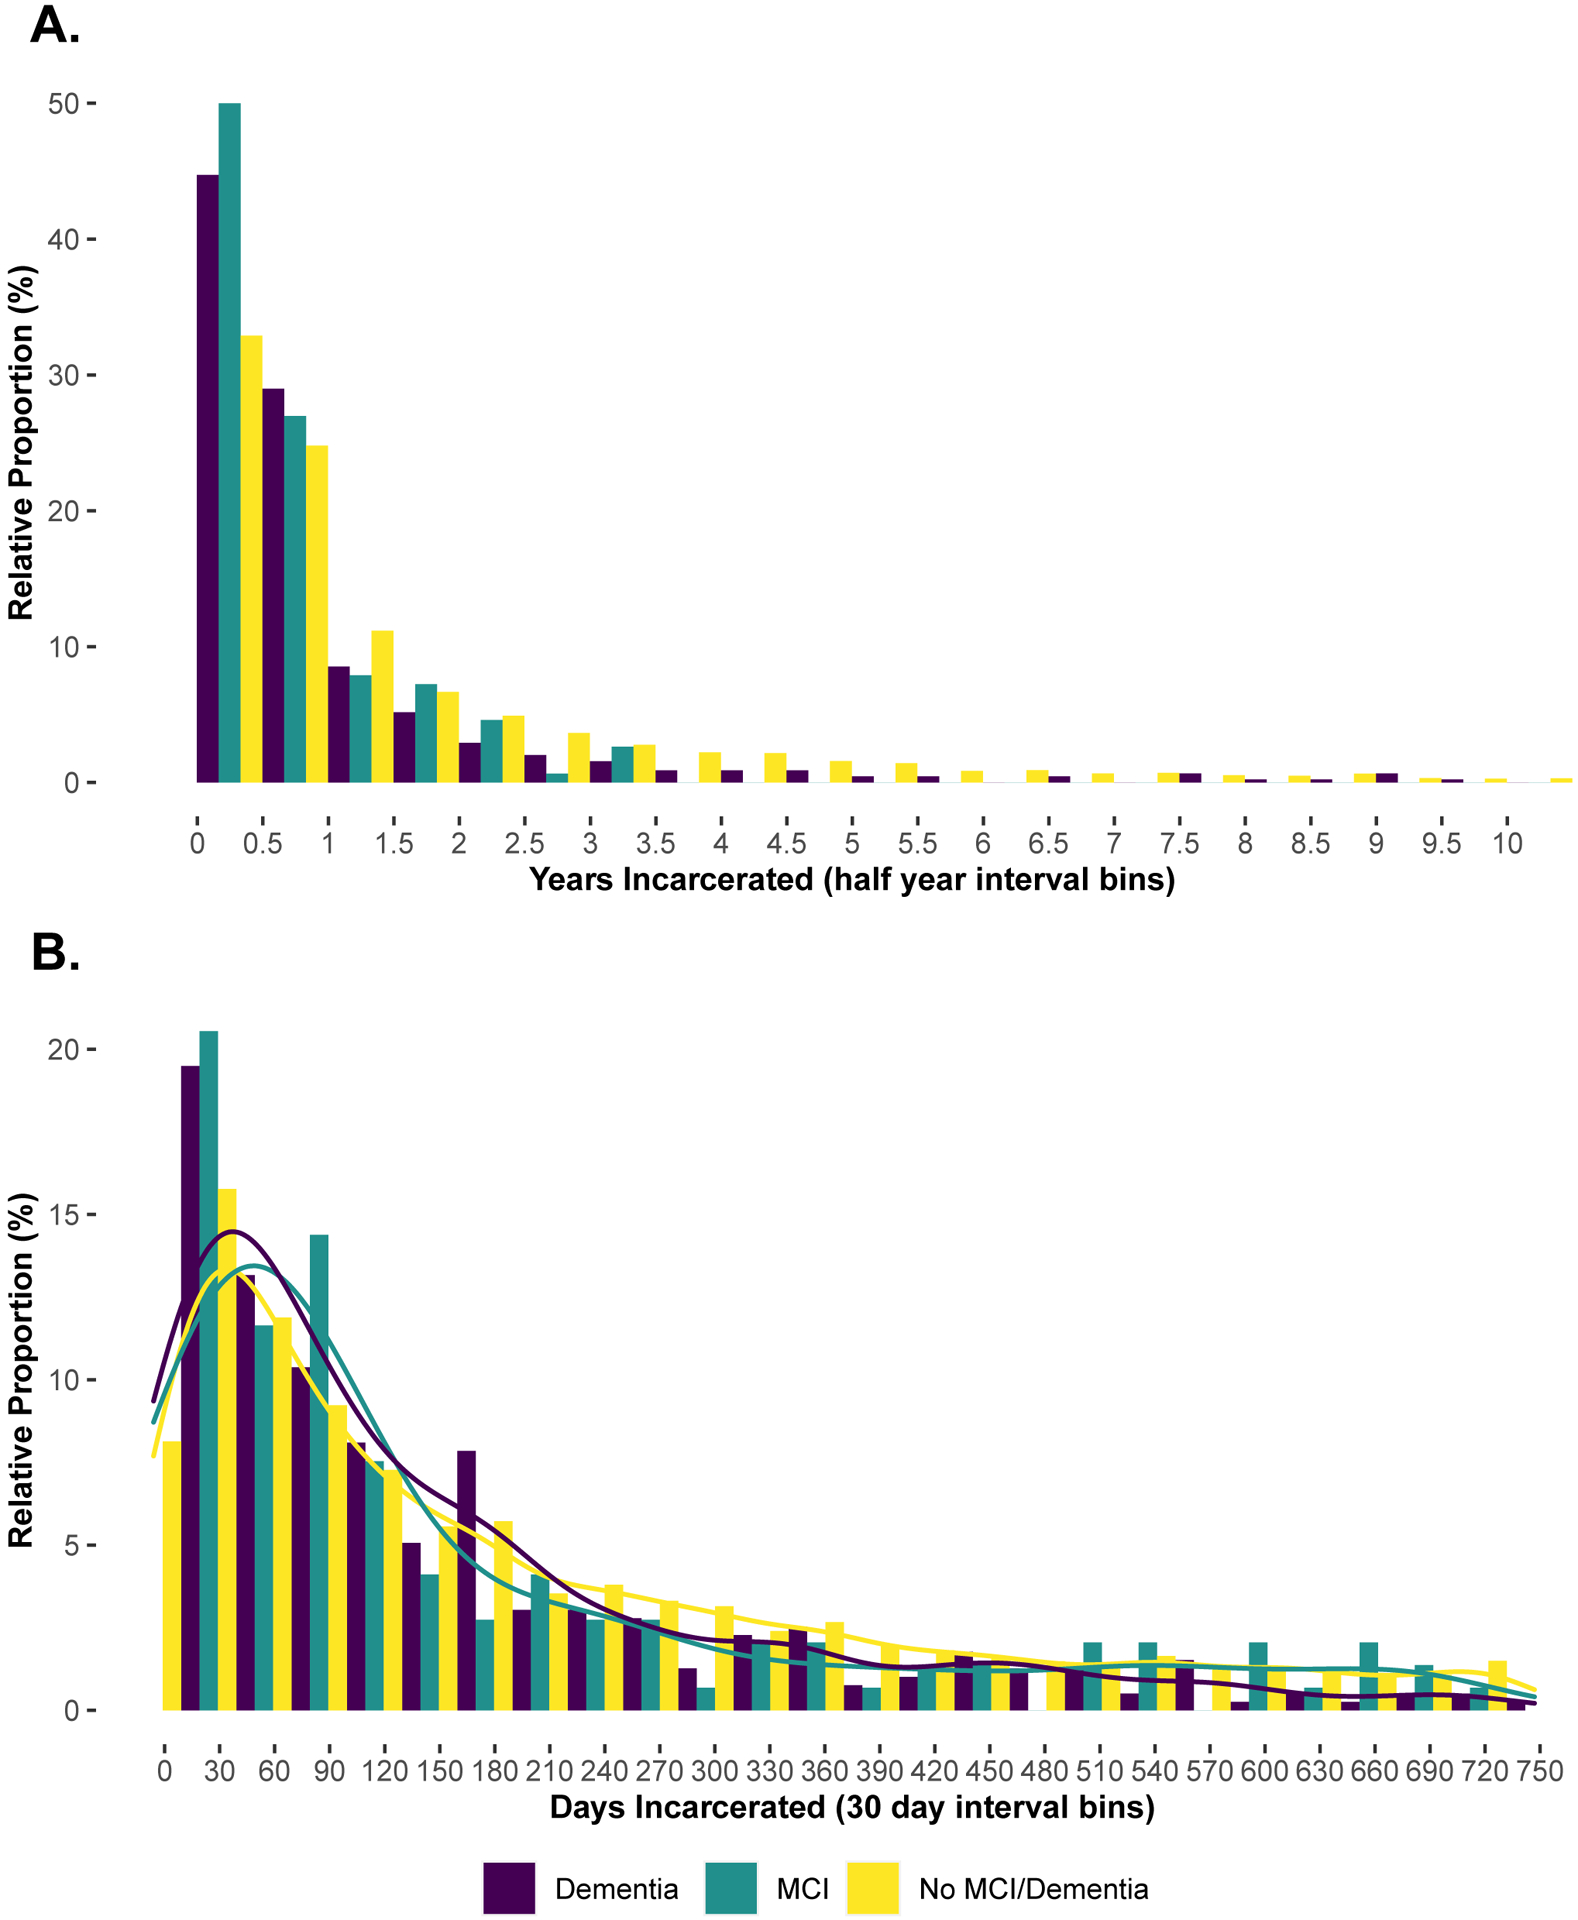
Figure 1. Distribution of incarceration duration by cognitive status.

Panel A: Distribution of the duration of incarceration in half-year intervals according to cognitive status for the entire sample (N=17,962). Panel B: Distribution of the duration of incarceration in 30-day intervals according to cognitive status for those incarcerated ≤ 2 years (N= 14,134).
