Figure 5.
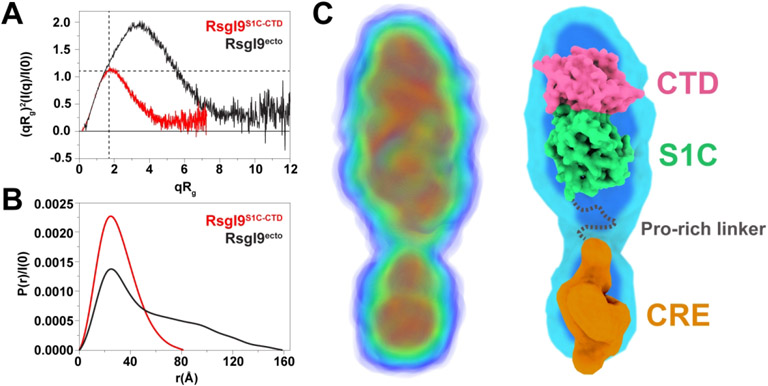
SAXS analyses show the RsgI9 ectodomain forms an extended structure. (A) Dimensionless Kratky plots of both the RsgI9S1C-CTD bi-domain unit (red) and intact ectodomain, RsgI9ecto (black). The two dashed lines indicate the theoretical peak position for a typical globular protein. The bi-domain unit behaves as a compact globular protein, while the intact ectodomain forms an extended rod-like structure. (B) Distance distribution function P(r) for both RsgI9S1C-CTD (red, Dmax 82 Å) and RsgI9ecto (black, Dmax 160 Å). (C) SAXS derived electron density reconstruction of the ectodomain obtained using the program DENSS49. The volume of electron density is colored with a gradient from blue to red to indicate regions of highest density (left). Coordinates of the crystal structure of RsgI9S1C-CTD fitted into the electron density (right). A low-resolution model of the CRE domain that was obtained using the program DENSS and RsgI9CRE SAXS data is also fitted into the density.

