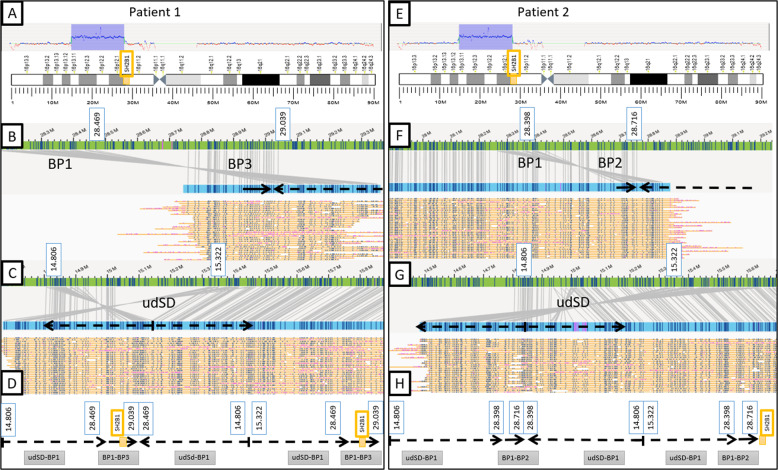
Fig. 3. Schematic representation of the chromosomal rearrangements identified by optical genome mapping.
A, E Detection of the 16p13.11p11.2 triplication (Copy Number = 4, udSD-BP1 region) for both patients and detection of the 16p11.2 duplication (Copy Number = 3, BP1–BP3 region for patient 1 and BP1–BP2 region for patient 2). B, C, F, G Optical maps spanning the junctions between adjacent segments. The patients’ optical maps are indicated in blue, the genome reference hg38’s are indicated in green. The molecules used to assemble the optical maps are indicated in yellow. B, F Optical maps spanning the junction between either the BP1–BP3 region (patient 1) or BP1–BP2 region (patient 2) and the second copy of udSD-BP1 region. On the rearranged chromosome, BP1 in an inverted orientation is located directly proximal to BP3 or BP2 (for patient 1 and 2, respectively) proving that the middle udSD-BP1 repeat has an inverted orientation. C, G Optical maps spanning the junction between the two proximal udSD-BP1 repeats. The junction is located in the distal udSD which is ~700 kb in size. The inverted sequences allow us to prove that the two proximal udSd-BP1 have inverted orientations. D, H Schematic representation of the rearrangement of the chromosome 16 for both patients. The three udSD-BP1 repeats have a direct-inverted-direct orientation. The two BP1–BP3 or BP1–BP2 repeats (for patient 1 and 2, respectively) have a direct orientation and the distal repeat is located between the two distal udSD-BP1 repeats.

